

Explore how fragmentation measurements support better decisions from blasting through mineral processing, including rock characterization, crusher feed monitoring, and continuous particle size analysis.
Table of contents
- 1. Start with the Process, Not the Measurement
- 2. Before Blasting: Understanding the Rock Mass
- 3. After Blasting: Measuring What Was Produced
- 4. From Pit to Plant: Measuring Material During Haulage
- 5. Through Processing: Continuous Conveyor Monitoring
- 6. Choosing Where to Measure
- 7. Periodic Sampling and Continuous Monitoring
- 8. Turning Measurements into Process Decisions
- 9. Case Study: Connecting Blast Fragmentation to Crusher Requirements
- 10. Building Long-Term Visibility Across the Life of a Mine
- Conclusion
Rock fragmentation influences nearly every stage of mining and mineral processing. The size and distribution of material produced by blasting affect how efficiently it can be excavated, transported, crushed, and ground. Changes in fragmentation can influence equipment performance, processing costs, and the consistency of material moving through an operation.
Yet these stages are often evaluated independently. Blasting teams assess their results, crusher operators monitor equipment performance, and processing personnel respond to changes in feed conditions. Without reliable measurements connecting these activities, it can be difficult to determine where variability originates or which adjustments will provide the greatest benefit.
Fragmentation measurement helps connect these stages by turning material size and other characteristics into data that can be compared, monitored, and used to guide operational decisions.
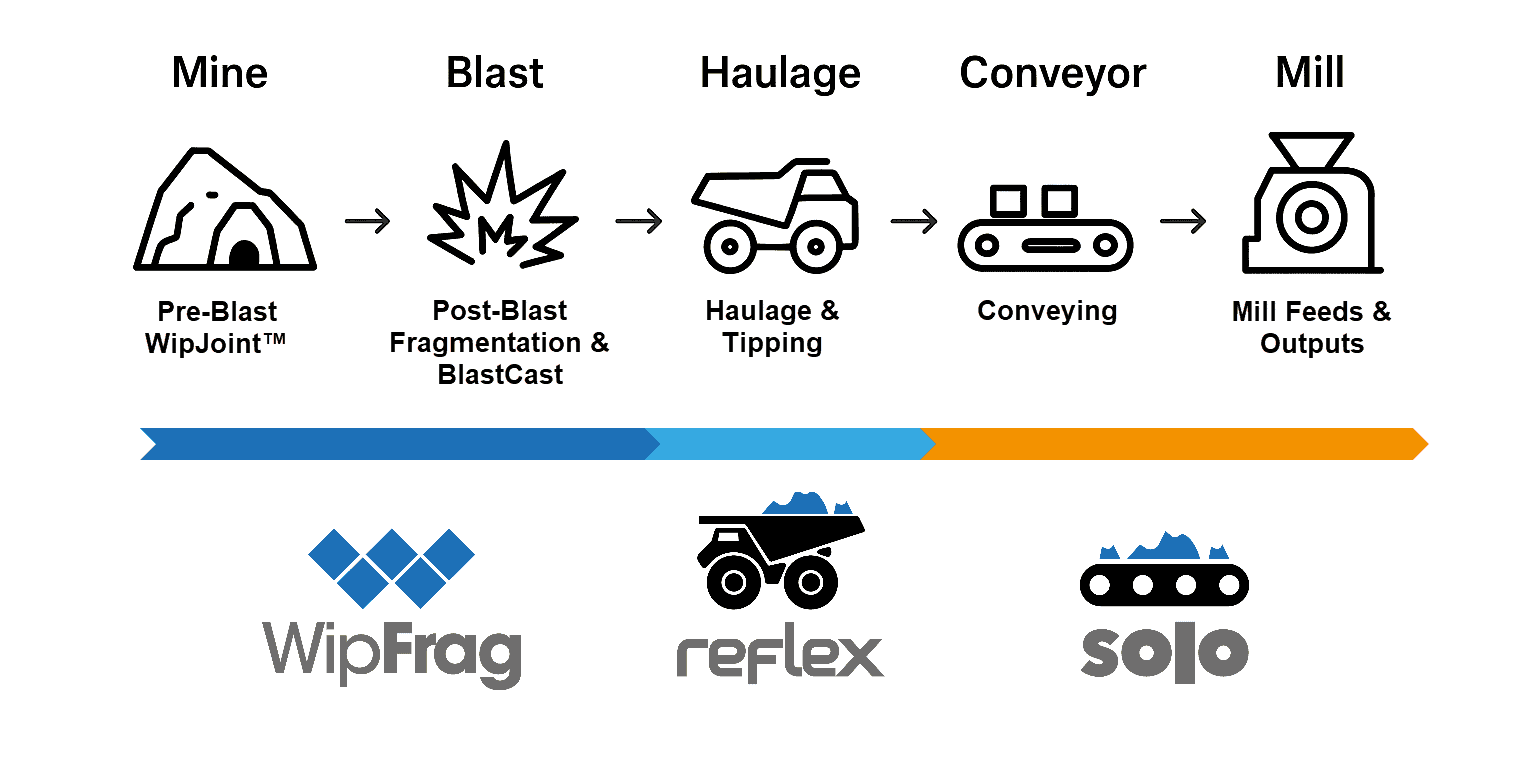
From pre-blast rock characterization to continuous conveyor monitoring, pit-to-plant fragmentation monitoring helps operations understand material behaviour, evaluate process performance, and identify opportunities for improvement throughout the life of a mine.
Jump to:
1. Start with the Process, Not the Measurement
•
2. Before Blasting: Understanding the Rock Mass
•
3. After Blasting: Measuring What Was Produced
•
4. From Pit to Plant: Measuring Material During Haulage
•
5. Through Processing: Continuous Conveyor Monitoring
•
•
7. Periodic Sampling and Continuous Monitoring
•
8. Turning Measurements into Process Decisions
•
9. Case Study: Connecting Blast Fragmentation to Crusher Requirements
•
10. Building Long-Term Visibility Across the Life of a Mine
•
•
1. Start with the Process, Not the Measurement
Before deciding where to measure fragmentation, it is important to understand what the operation is trying to achieve.
An acceptable particle size distribution (PSD) for one process may be unsuitable for another. Material that is easily handled by a large primary crusher may create difficulties in a smaller downstream crusher. Similarly, feed characteristics that support stable grinding performance at one operation may be undesirable at another.
The first step is therefore to establish the material characteristics that matter to each process.
These might include:
- Maximum particle size entering a crusher or material handling system.
- Particle size distribution feeding a crusher or grinding mill.
- The percentage of material within an acceptable size range.
- Changes in particle size or shape between processing stages.
- Variations in material characteristics between mining areas or feed sources.
- Compliance with aggregate gradation requirements or other product specifications.
Once these requirements are understood, the operation can identify the measurements needed to evaluate them.
Understanding Particle Size Distribution
Particle size distribution describes the relative proportions of different particle sizes within a material sample.
It is commonly presented as a cumulative percent-passing curve, showing the percentage of material smaller than a given particle size.
One frequently used measurement is P80, the particle size at which 80% of the material passes. Other measurements, such as P50 and P95, describe different portions of the distribution.
P80 is useful for comparing feed and product sizes, tracking process changes, and evaluating crushing and grinding performance. However, it should not be treated as a complete description of the material.
Two samples can have the same P80 while containing very different proportions of oversize, intermediate particles, or fines.
For example, an operation concerned with crusher blockages may need to monitor the largest particles and the percentage exceeding a specific size limit. In that case, P80 alone may not provide the information needed to make a decision.
For a more detailed explanation, see Understanding P80 in Crushing and Material Processing.
Using Specification Envelopes
A specification envelope defines acceptable limits for a particle size distribution.
Rather than evaluating a PSD curve without context, operators can compare measured results with an established range of acceptable material sizes.
These limits may be based on equipment requirements, product specifications, operating targets, or other performance criteria.
For example, a crusher may have a maximum acceptable feed size, while an aggregate producer may need to maintain a product gradation within specified limits.
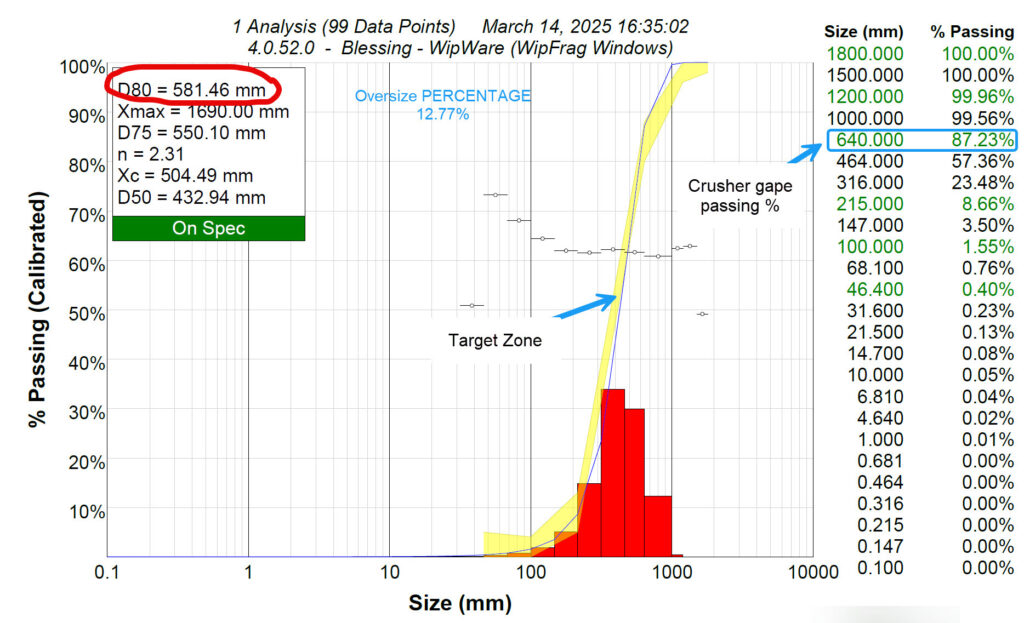
WipWare’s measurement technologies can help operators evaluate material against defined particle size criteria. In WipFrag, specification envelopes provide a visual reference for comparing measured PSD curves with the desired distribution.
By establishing what constitutes acceptable material before collecting measurements, operations can more readily identify meaningful deviations and determine when further investigation or corrective action is required.
Jump to:
1. Start with the Process, Not the Measurement
•
2. Before Blasting: Understanding the Rock Mass
•
3. After Blasting: Measuring What Was Produced
•
4. From Pit to Plant: Measuring Material During Haulage
•
5. Through Processing: Continuous Conveyor Monitoring
•
•
7. Periodic Sampling and Continuous Monitoring
•
8. Turning Measurements into Process Decisions
•
9. Case Study: Connecting Blast Fragmentation to Crusher Requirements
•
10. Building Long-Term Visibility Across the Life of a Mine
•
•
2. Before Blasting: Understanding the Rock Mass
Fragmentation begins with the characteristics of the rock itself.
Rock strength, density, joint spacing, bedding, faults, and other geological features influence how explosive energy interacts with the material and how fragments develop.
Even where drilling patterns and explosive loading remain consistent, changes in geological conditions can produce different fragmentation results.
Understanding these conditions before blasting provides valuable context when evaluating the results afterward.
Rock Structure Characterization with WipJoint
WipFrag includes WipJoint, a tool for characterizing rock structure from photographs of exposed rock faces.
WipJoint measures apparent joint orientation, spacing, and persistence, along with estimated Rock Quality Designation (RQD) and apparent in-situ block size.
These measurements help describe structural variations within a rock mass that may influence how the material responds to blasting.
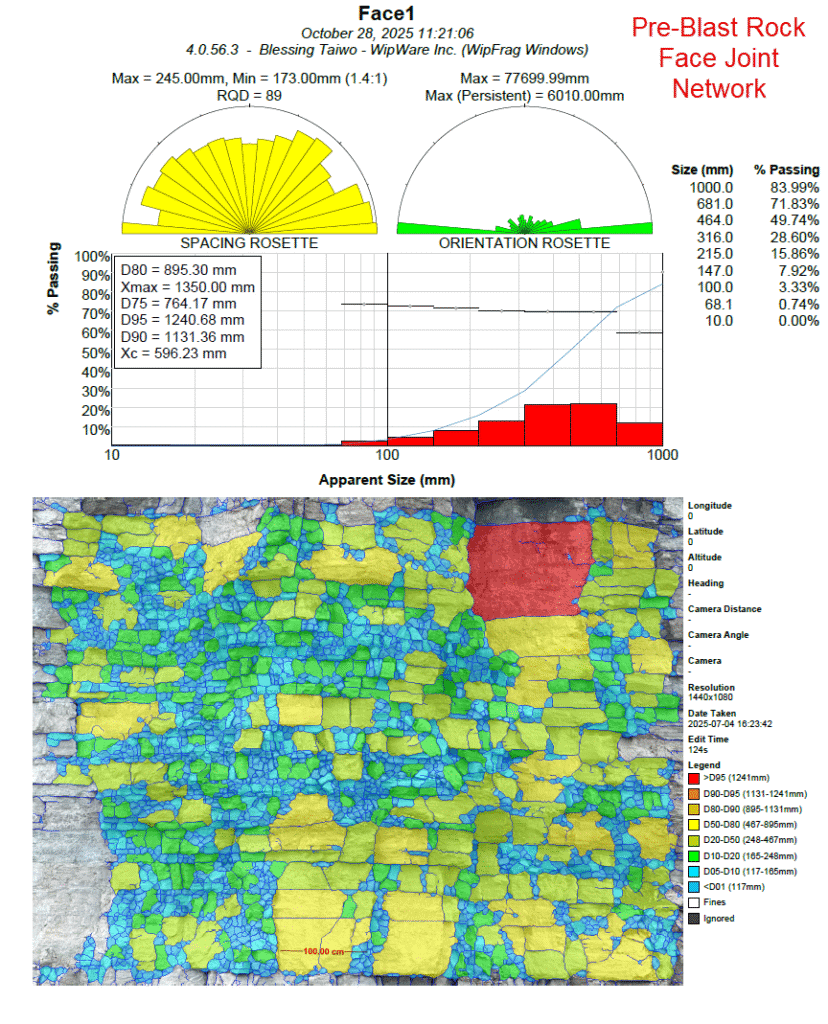
For example, a heavily fractured zone may break differently from an adjacent area containing larger, more competent rock blocks.
Comparing pre-blast structural characteristics with the fragmentation produced afterward can help engineers better understand these differences and evaluate the influence of geological conditions on blasting performance.
Establishing Fragmentation Objectives
Before a blast, the operation can also establish fragmentation targets based on the requirements of downstream equipment.
These targets might include limiting oversize material that requires secondary breaking, producing a suitable feed size for the primary crusher, or maintaining a particular particle size distribution for subsequent processing.
Where appropriate, WipFrag’s BlastCast tool can be used to compare modelled fragmentation with measured results from previous blasts.
BlastCast uses the Kuz-Ram-Cunningham-Ouchterlony (KCO) model to predict fragmentation based on blast-design parameters, explosive characteristics, and rock conditions.
By calibrating the model’s Rock Factor against actual fragmentation measurements, engineers can establish a baseline for comparing how changes to selected blast-design parameters may influence the predicted PSD under similar rock conditions.
These assessments provide a basis for evaluating possible changes, although actual blasting results must still be measured to confirm the outcome.
For more information about the physical mechanisms and design factors influencing fragmentation, see Understanding Rock Blasting and Fragmentation.
Jump to:
1. Start with the Process, Not the Measurement
•
2. Before Blasting: Understanding the Rock Mass
•
3. After Blasting: Measuring What Was Produced
•
4. From Pit to Plant: Measuring Material During Haulage
•
5. Through Processing: Continuous Conveyor Monitoring
•
•
7. Periodic Sampling and Continuous Monitoring
•
8. Turning Measurements into Process Decisions
•
9. Case Study: Connecting Blast Fragmentation to Crusher Requirements
•
10. Building Long-Term Visibility Across the Life of a Mine
•
•
3. After Blasting: Measuring What Was Produced
Once a blast is completed, fragmentation analysis provides the first opportunity to evaluate the resulting material against the original objectives.
Visual assessments can reveal obvious oversize or uneven fragmentation, but they cannot consistently quantify the particle size distribution.
WipFrag converts photographs of exposed fragmented material into particle size distribution measurements, allowing operators to compare blast results quantitatively.
Images can be collected from muckpiles, benches, underground stopes, stockpiles, and other accessible material. Unmanned aerial vehicles (UAVs) can also provide imagery covering larger exposed areas.
Comparing Blasts and Identifying Variability
Quantitative measurements make it possible to compare fragmentation between different blasts, mining areas, geological conditions, and design configurations.
For example, an operation may compare the percentage of oversize material produced by successive blasts or assess whether changes in the drilling pattern are associated with a shift in the PSD.
Multiple images can be combined to represent a broader sampling area, while suitable UAV imagery can help reveal spatial differences across a muckpile.
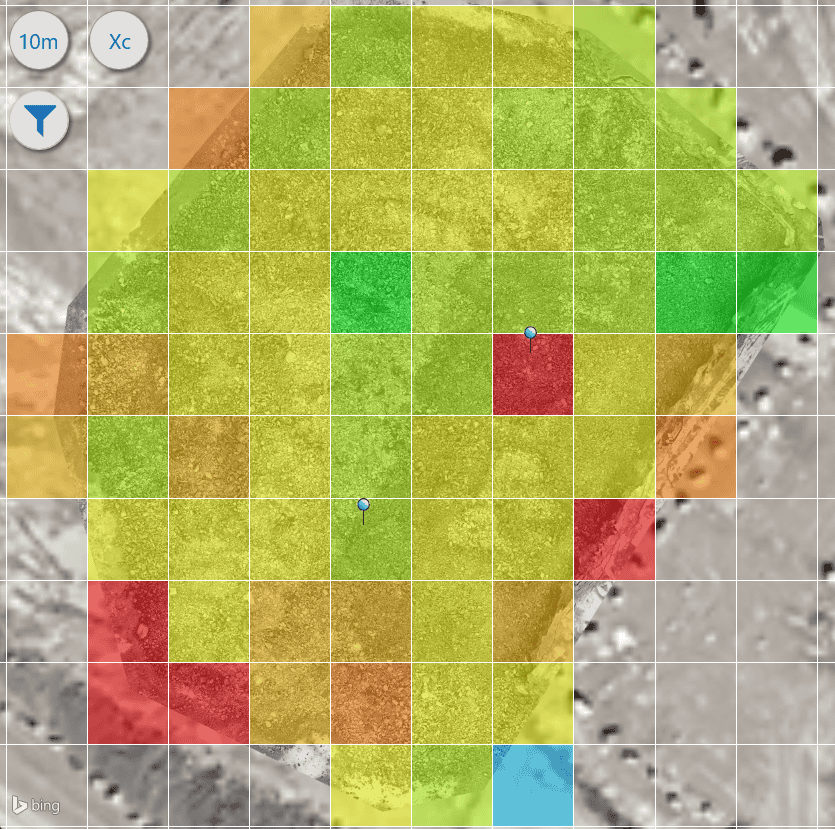
A fragmentation map may show that one area contains consistently larger fragments than another. When compared with geological observations and drilling records, this information can help identify conditions requiring further investigation.
However, fragmentation measurements do not independently establish why a particular result occurred. Similar patterns can arise from differences in rock structure, burden, spacing, explosive distribution, or other factors.
The greatest value comes from evaluating the measurements alongside the corresponding blast records.
Measuring Representative Material
As with any sampling method, the usefulness of fragmentation data depends on whether the measurements represent the material being evaluated.
Images should be collected from appropriate locations and under suitable conditions, with enough samples to account for material variability.
Photographic analysis measures particles visible at the surface. Buried material and particles obscured by larger fragments cannot be measured directly.
For practical guidance, see the WipFrag Image Capture & Sampling Guide.
Professional Fragmentation Analysis with MailFrag
Not every operation has the personnel, time, or resources to conduct fragmentation analysis internally.
For these applications, WipWare offers MailFrag, a professional analysis service available through WipFrag.
Users prepare and submit their images with the appropriate scaling information, and WipWare’s analysis specialists complete the particle delineation, review, and analysis. The completed results are returned through WipFrag.
This provides an alternative for operations that require quantitative fragmentation measurements without performing the analysis themselves.
MailFrag can be particularly useful for occasional fragmentation assessments, specialized projects, or organizations seeking assistance with their analysis workflow.
Whether performed internally or through MailFrag, the objective remains the same: obtain reliable, representative fragmentation measurements that can support meaningful operational decisions.
Jump to:
1. Start with the Process, Not the Measurement
•
2. Before Blasting: Understanding the Rock Mass
•
3. After Blasting: Measuring What Was Produced
•
4. From Pit to Plant: Measuring Material During Haulage
•
5. Through Processing: Continuous Conveyor Monitoring
•
•
7. Periodic Sampling and Continuous Monitoring
•
8. Turning Measurements into Process Decisions
•
9. Case Study: Connecting Blast Fragmentation to Crusher Requirements
•
10. Building Long-Term Visibility Across the Life of a Mine
•
•
4. From Pit to Plant: Measuring Material During Haulage
Fragmentation measurements collected from a muckpile describe the material at a particular stage of the operation. However, material characteristics can vary considerably as different areas are excavated, blended, transported, and delivered to processing.
This creates another opportunity for measurement.
Vehicle Load Analysis with Reflex
Reflex is an automated particle measurement system designed for material carried in haul trucks, loaders, railcars, and other vehicles.
Depending on the installation, the system can capture material in a vehicle load or as it is discharged at a receiving location.

Reflex Basic provides focused maximum-size or colour monitoring, while Reflex Complete provides particle size distribution, shape, and colour measurements.
These measurements allow operators to compare material from one vehicle load to another and identify changes before the material reaches downstream equipment.
Connecting Loading and Haulage to Processing
Load-by-load measurements can be particularly useful when material is delivered from different blasting areas or when the operation experiences substantial variability in crusher feed.
For example, monitoring the size distribution of material arriving at a primary crusher can help operators determine whether coarse feed conditions are isolated or recurring.
Where load identity, location, and dispatch information are available, fragmentation results can also be associated with particular mining areas or material movements.
This provides a way to connect upstream fragmentation conditions with the material being delivered to processing.
The information may support operational decisions involving material routing, feed management, oversize handling, or further investigation of a particular source.
Tracking Changes Between the Pit and the Crusher
Measurements collected at different stages can also help distinguish between fragmentation as initially produced by blasting and the material subsequently delivered to processing.
The material visible in a muckpile is not necessarily identical in distribution to the material arriving at a crusher. Loading practices, material segregation, blending, and handling can all influence the composition of individual loads.
Comparing measurements from different locations provides additional context about these changes.
This is particularly valuable when an operation is trying to understand whether inconsistent crusher feed originates with blasting, material handling, or the combination of multiple feed sources.
The objective is not necessarily to measure every fragment, but to collect useful, consistent information about the material moving between stages.
Jump to:
1. Start with the Process, Not the Measurement
•
2. Before Blasting: Understanding the Rock Mass
•
3. After Blasting: Measuring What Was Produced
•
4. From Pit to Plant: Measuring Material During Haulage
•
5. Through Processing: Continuous Conveyor Monitoring
•
•
7. Periodic Sampling and Continuous Monitoring
•
8. Turning Measurements into Process Decisions
•
9. Case Study: Connecting Blast Fragmentation to Crusher Requirements
•
10. Building Long-Term Visibility Across the Life of a Mine
•
•
5. Through Processing: Continuous Conveyor Monitoring
Once material enters the crushing and processing circuit, its particle size distribution continues to change.
Crushers reduce larger particles, screens separate material into size ranges, and grinding circuits prepare feed for subsequent processing.
At the same time, differences in rock properties, equipment condition, operating settings, and incoming material can cause the size distribution to vary.
Conveyors provide useful locations to monitor these changes while material is moving through the operation.
Conveyor Particle Measurement with Solo
Solo is an automated conveyor measurement system that repeatedly captures and analyzes material as it travels through a processing circuit.
Depending on its configuration, Solo can provide maximum particle size, particle size distribution, particle shape, estimated volume, and colour measurements.

Solo Basic provides focused maximum-size or colour monitoring, while Solo Complete offers full PSD analysis and additional material measurements.
These capabilities allow operations to select a measurement approach appropriate to the decision being supported.
For example, detecting material that exceeds a particular size limit may only require maximum particle size monitoring. Understanding how the complete distribution changes through crushing or blending generally requires PSD measurements.
Monitoring Crusher Performance
Installing a measurement system after a crusher allows operators to evaluate the material being produced.
Changes in product size may indicate variations in feed characteristics, operating conditions, crusher settings, or equipment wear.
A developing oversize trend can prompt an operator to investigate whether the crusher is producing material outside the desired range.
Where permitted by the equipment and control strategy, measurement data can also be integrated into process control systems to support alarms or automated adjustments.
However, the measurements do not independently establish the cause of a change. Crusher operating data and other process information are needed to determine the appropriate response.
Screening and Oversize Detection
Screening operations present another useful measurement point.
When a screen wears, becomes damaged, or performs poorly, unexpected material sizes may begin appearing in its output.
Monitoring material downstream of a screen can help identify particles exceeding the intended size limit.
An alert may allow operators to investigate a developing problem before significant quantities of out-of-spec material enter a stockpile, processing circuit, or finished product stream.
The usefulness of this application depends on the particle sizes involved and whether they can be reliably resolved by the measurement system.
Grinding Circuit Feed Monitoring
Material size entering an autogenous (AG) or semi-autogenous grinding (SAG) circuit can strongly influence how the mill operates.
Variations in the feed size distribution may affect grinding behaviour, circulating loads, and mill stability.
Measuring material on a conveyor feeding the mill can provide information about these changes and help operators evaluate the relationship between feed characteristics and process performance.
Depending on the operation, these measurements may support decisions involving feed rates, stockpile blending, or advanced process control.
The objective is not necessarily to maintain the smallest possible feed size, but to provide material appropriate for the grinding circuit and its operating conditions.
Understanding Changes Across Processing Stages
Measurements become particularly informative when results from different processing locations can be compared.
For example, measurements collected before and after a crusher can help operators understand the relationship between incoming material and the resulting product.
Measurements at several points in a crushing circuit may reveal how changes in one stage influence the material delivered to the next.
Where appropriate, particle size data can also be evaluated alongside throughput, crusher settings, equipment power consumption, and other operating information.
This broader context helps distinguish changes in material characteristics from changes in equipment performance.
Jump to:
1. Start with the Process, Not the Measurement
•
2. Before Blasting: Understanding the Rock Mass
•
3. After Blasting: Measuring What Was Produced
•
4. From Pit to Plant: Measuring Material During Haulage
•
5. Through Processing: Continuous Conveyor Monitoring
•
•
7. Periodic Sampling and Continuous Monitoring
•
8. Turning Measurements into Process Decisions
•
9. Case Study: Connecting Blast Fragmentation to Crusher Requirements
•
10. Building Long-Term Visibility Across the Life of a Mine
•
•
6. Choosing Where to Measure
There is no single ideal measurement location for every operation.
The most useful location depends on the material, equipment, operating challenges, and the decisions that measurements are intended to support.
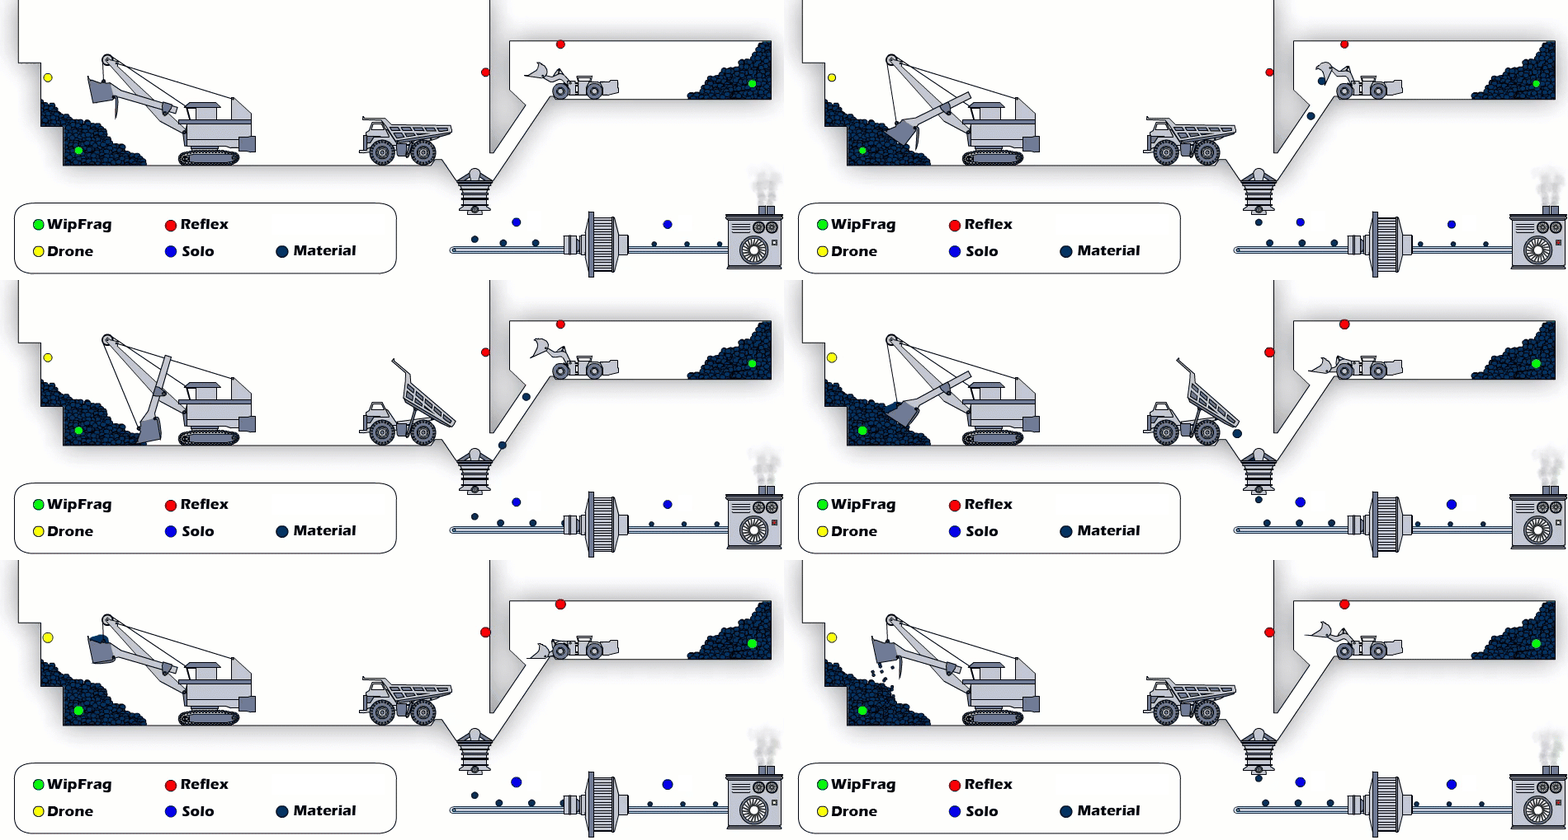
A practical approach is to start with the process question, then identify where the relevant material can be measured.
| Measurement location | What the measurement can help evaluate |
|---|---|
| Pre-blast rock face | Geological structure and conditions influencing fragmentation |
| Blasted muckpile | Blast performance, oversize, PSD, and spatial variability |
| Vehicle loads or discharge points | Load-to-load variation and material arriving from different sources |
| Pre-primary crusher | Incoming feed characteristics and material variability |
| Post-primary crusher | Crusher product size, oversize trends, and performance changes |
| Post-secondary or tertiary crusher | Product consistency and the effects of crushing adjustments |
| Post-screen conveyor | Unexpected oversize, screen performance, and product compliance |
| Grinding circuit feed | Feed size variability, blending decisions, and process stability |
These locations are not interchangeable. Each answers a different operational question.
Before or After a Crusher?
A measurement before a crusher describes the material entering the machine. It can help establish whether variations in feed size may be contributing to changes in performance.
A measurement after the crusher describes the material produced. It can help evaluate whether the output meets the desired requirements and whether the distribution changes over time.
Both measurements can be useful together because they provide information about the relationship between incoming material and the resulting product.
However, the additional information only creates value when the operation has a reason to use it.
Choosing the Right Measurement System
Selecting a measurement system involves more than determining where it will be installed. The technology must also provide the information needed to support the intended operational decision.
WipWare offers different measurement approaches based on how material is presented and what characteristics need to be evaluated.
- WipFrag supports on-demand fragmentation and particle analysis from photographs collected in the field, laboratory, underground, or by UAV.
- Reflex provides automated measurements of material in vehicle loads or during discharge, helping operations monitor load-to-load variability.
- Solo provides repeated measurements of material on conveyors and process lines, supporting continuous monitoring and process control.
For automated systems, choosing between Basic and Complete configurations depends on the information required.
Basic — Focused Monitoring
Solo Basic and Reflex Basic are designed for applications where the primary objective is to monitor maximum particle size or material colour.
For example, an operation may need to identify oversize material approaching a crusher, detect unexpected particles after screening, or monitor colour changes that could indicate differences in material characteristics.
Where a single measurement can provide the required operational signal, Basic may offer a more appropriate solution than full PSD analysis.
Complete — Comprehensive Material Analysis
Solo Complete and Reflex Complete provide full particle size distribution measurements, along with particle shape and colour information. Solo Complete also provides estimated material volume.
These configurations are useful when operations need to understand changes across multiple particle size classes, compare complete distributions, or evaluate material characteristics over time.
Applications include monitoring crusher performance, evaluating grinding circuit feed, comparing material from different sources, and assessing compliance with particle size targets.
Matching the Measurement to the Application
A more comprehensive measurement system is not necessarily more useful for every application.
For example, detecting particles above a defined size limit may require only maximum-size monitoring. By contrast, understanding how a crusher changes the overall particle size distribution generally requires more detailed PSD measurements.
The appropriate system also depends on whether the material can be measured reliably under the proposed installation conditions.
Factors such as particle size, visibility, field of view, mounting distance, material movement, and environmental conditions all influence system selection.
The objective is to select the measurement capability that provides useful information for the process, without introducing unnecessary complexity.
Understanding Detectable Particle Size Ranges
An important consideration when selecting a measurement location is whether the system can reliably distinguish the particle sizes that matter to the operation.
For optical conveyor monitoring, the detectable size range depends on camera resolution, lens selection, mounting distance, and field of view. A wider field of view allows the system to observe a larger area of material but reduces the image detail available for identifying smaller particles. A narrower field of view improves resolution for smaller particles but may limit coverage of larger material or the full material stream.
For example, monitoring coarse primary crusher output on a wide conveyor presents different requirements from measuring smaller material feeding a grinding mill. The appropriate camera configuration must account for both the material size distribution and the physical conditions at the measurement location.
These considerations are particularly important when selecting between maximum-size detection and complete particle size distribution analysis.
For a more detailed explanation, including practical installation examples, see Understanding Size Ranges in Conveyor Belt Analysis.
Jump to:
1. Start with the Process, Not the Measurement
•
2. Before Blasting: Understanding the Rock Mass
•
3. After Blasting: Measuring What Was Produced
•
4. From Pit to Plant: Measuring Material During Haulage
•
5. Through Processing: Continuous Conveyor Monitoring
•
•
7. Periodic Sampling and Continuous Monitoring
•
8. Turning Measurements into Process Decisions
•
9. Case Study: Connecting Blast Fragmentation to Crusher Requirements
•
10. Building Long-Term Visibility Across the Life of a Mine
•
•
7. Periodic Sampling and Continuous Monitoring
Traditional sieve analysis remains an important method of particle size measurement.
When properly performed, it provides a physical assessment of the sampled material and can include fractions that are difficult to resolve through optical measurements.
However, a sample collected periodically represents the material taken at that particular time and location.
If material characteristics change significantly between samples, those variations may not be captured.
The Value of More Frequent Measurements
Automated monitoring systems repeatedly collect measurements while material moves through the process.
Instead of relying entirely on measurements taken at occasional intervals, operators can observe developing trends, compare operating periods, and identify unexpected changes.
For example, a crusher may produce material within the desired size range during a scheduled sampling period but experience intermittent oversize events during other operating conditions.
A monitoring system can provide additional information about those variations.
Continuous monitoring does not mean that every particle is measured. Optical systems sample visible material at repeated intervals, and their results are influenced by the measurement frequency, installation geometry, and characteristics of the material.
Nevertheless, repeated measurements can reveal patterns that periodic sampling alone may miss.
Why Both Methods Matter
Automated optical measurements and physical sieve analysis provide complementary information.
Sieve analysis can help characterize bulk material and provide reference measurements, while automated systems provide more frequent observations of process behaviour.
Where appropriate, comparative sampling and calibration can help establish relationships between optical measurements and laboratory results.
Rather than treating one method as a replacement for the other, operations can combine them to support a more comprehensive understanding of material size and process variability.
The objective is to collect measurements that are both meaningful and sufficiently representative of the decisions they will inform.
Jump to:
1. Start with the Process, Not the Measurement
•
2. Before Blasting: Understanding the Rock Mass
•
3. After Blasting: Measuring What Was Produced
•
4. From Pit to Plant: Measuring Material During Haulage
•
5. Through Processing: Continuous Conveyor Monitoring
•
•
7. Periodic Sampling and Continuous Monitoring
•
8. Turning Measurements into Process Decisions
•
9. Case Study: Connecting Blast Fragmentation to Crusher Requirements
•
10. Building Long-Term Visibility Across the Life of a Mine
•
•
8. Turning Measurements into Process Decisions
Collecting more data does not automatically improve an operation.
The practical value of measurement comes from establishing how the information will be evaluated and what action may be taken when conditions change.
A useful monitoring strategy links three elements:
- Measurement: What material characteristic is being monitored?
- Target: What range or condition is considered acceptable?
- Response: What should happen when the measurement indicates a meaningful deviation?
Using Size Limits and Specification Envelopes
A maximum particle size limit may be sufficient when the objective is to detect oversize material that could interfere with downstream equipment.
Other applications require monitoring the overall PSD against a specification envelope.
For example, a process may require that a particular percentage of material remain within an acceptable size range rather than simply remaining below a maximum size.
Comparing measurements against these limits allows operators to identify whether the material is within specification and how its distribution changes.
The appropriate limits must be established from the requirements of the equipment or process, rather than from general particle size targets.
From Alerts to Automation
Measurement results can be presented to operators for review, connected to alarms, or incorporated into a plant control system where supported.
WipWare’s automated systems can communicate measurement data through industrial protocols such as Modbus TCP and OPC UA.
This makes it possible to integrate particle measurements with other operating information used by a PLC, SCADA system, or control strategy.
For example, detecting a developing oversize condition after a crusher might prompt an operator to review the crusher settings or equipment condition.
With suitable engineering and safeguards, the measurement could also contribute to an automated control strategy.
One historical WipWare application at a mining operation in northern Quebec illustrates this approach. The operation needed to control material exceeding approximately 6 inches (150 mm) after primary crushing. Working with Xstrata Process Support (XPS) and a hydraulic toggle supplier, WipWare helped implement a system that identified oversize conditions and communicated with a PLC to support automatic crusher-setting adjustments.
The application demonstrates how particle measurements can become practical control inputs when integrated with appropriate equipment and process safeguards.
The decision to automate should depend on how reliably the measurement represents the process, how quickly a response is needed, and the operating consequences of the proposed adjustment.
The objective is to use measurement as a dependable input to an appropriate operational decision, not to automate simply because data is available.
Jump to:
1. Start with the Process, Not the Measurement
•
2. Before Blasting: Understanding the Rock Mass
•
3. After Blasting: Measuring What Was Produced
•
4. From Pit to Plant: Measuring Material During Haulage
•
5. Through Processing: Continuous Conveyor Monitoring
•
•
7. Periodic Sampling and Continuous Monitoring
•
8. Turning Measurements into Process Decisions
•
9. Case Study: Connecting Blast Fragmentation to Crusher Requirements
•
10. Building Long-Term Visibility Across the Life of a Mine
•
•
9. Case Study: Connecting Blast Fragmentation to Crusher Requirements
A research program at dstgroup’s aggregate quarry in Portugal demonstrates how fragmentation measurement can connect blast evaluation with downstream processing requirements.
The research involved WipWare, O-Pitblast, and dstgroup, with the objective of improving the relationship between blasting performance and primary crusher compatibility.
Establishing a Measurable Baseline
The initial phase combined detailed bench topography, blasthole surveys, blast-design simulation, and fragmentation measurement.
Using WipFrag, the researchers evaluated particle size distributions from blasted material and compared the results with the quarry’s primary crusher requirements.
A crusher compatibility envelope helped identify material within the desired size range and oversize material requiring additional handling or breaking.
The initial assessments revealed differences between predicted and measured fragmentation, along with variations associated with blast geometry and drilling accuracy.
These findings provided a baseline for evaluating subsequent adjustments.
Evaluating Blast Design Changes
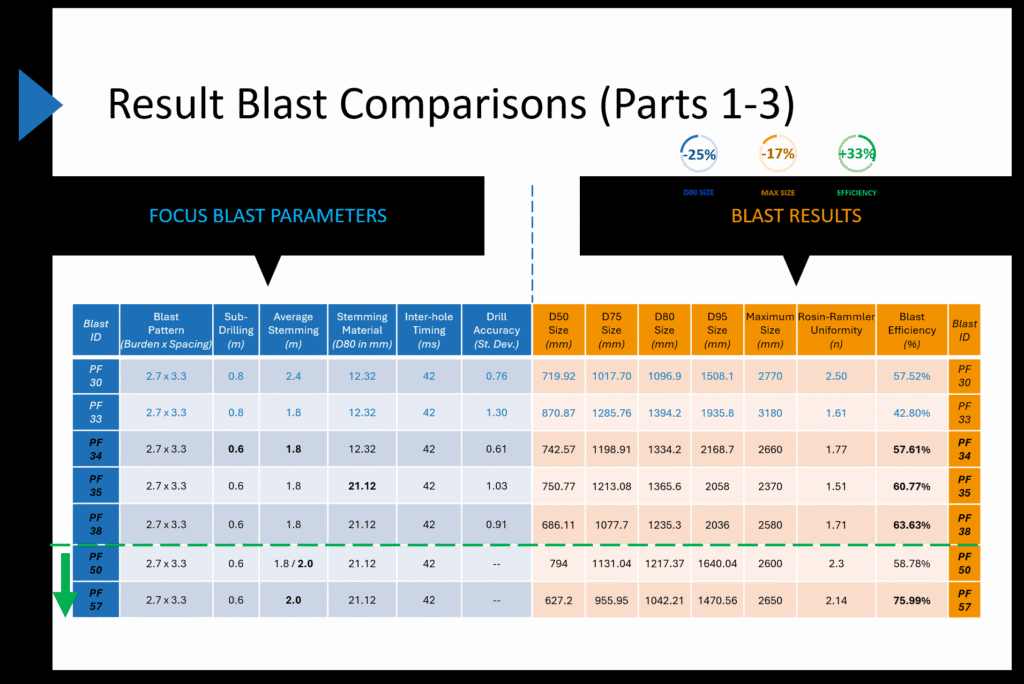
Later phases of the research investigated changes to blast-design parameters, including stemming properties, subdrilling, drilling accuracy, and initiation timing.
Fragmentation measurements were used to compare the outcomes and evaluate whether the changes brought the material closer to the crusher’s desired feed distribution.
The research ultimately demonstrated measurable improvements following targeted blast-design adjustments, including an 11% reduction in D80, a 19% reduction in maximum fragment size, and a 21% improvement in fragmentation efficiency. These changes brought the run-of-mine particle size distribution (PSD) 15% closer to the crusher compatibility envelope.
These results describe the particular conditions and comparisons used in the research, rather than performance improvements that can be assumed at other operations.
Extending Measurement to Crusher Feed
The research also incorporated automated measurements using Reflex near the primary crusher.
These observations helped evaluate material arriving for processing and provided an additional way to compare the effects of blast-design changes over time. As mentioned above, following the initial blast-design adjustments, the run-of-mine particle size distribution (PSD) moved 15% closer to the crusher compatibility envelope established during the baseline phase.
The significance of the work is not simply that one blast produced smaller fragments.
It demonstrates a measurement-driven process in which crusher requirements helped define the fragmentation targets, blast outcomes were measured, adjustments were evaluated, and subsequent material characteristics were monitored.
This approach connects the blasting operation with the requirements of downstream equipment rather than treating fragmentation as an isolated blasting result.
For further reading, see the published journal articles A Mine-to-Crusher Framework for Aggregate Operations: Part 1, Part 2 and Part 3.
Jump to:
1. Start with the Process, Not the Measurement
•
2. Before Blasting: Understanding the Rock Mass
•
3. After Blasting: Measuring What Was Produced
•
4. From Pit to Plant: Measuring Material During Haulage
•
5. Through Processing: Continuous Conveyor Monitoring
•
•
7. Periodic Sampling and Continuous Monitoring
•
8. Turning Measurements into Process Decisions
•
9. Case Study: Connecting Blast Fragmentation to Crusher Requirements
•
10. Building Long-Term Visibility Across the Life of a Mine
•
•
10. Building Long-Term Visibility Across the Life of a Mine
Individual measurements provide information about material at a particular time and location.
Their value can grow when results are collected consistently, associated with operating conditions, and compared over longer periods.
As mining progresses, operations encounter different geological zones, material characteristics, equipment conditions, and processing requirements.
Measurements collected over time can help document these changes and provide a reference for evaluating subsequent performance.
Connecting Measurements Across Stages
WipWare’s technologies provide complementary ways to characterize material throughout the mining and processing cycle:
- WipJoint characterizes exposed rock structure before blasting.
- WipFrag evaluates post-blast fragmentation and other accessible material samples.
- BlastCast helps compare measured fragmentation with modelled outcomes and investigate potential design changes.
- Reflex provides automated vehicle-load measurements between loading, haulage, and processing.
- Solo provides repeated material measurements on conveyors and process lines.
- MailFrag provides specialist-assisted WipFrag analysis where internal analysis resources are limited.
These technologies do not all measure material in the same way, nor do they need to be deployed together to provide value.
Each addresses a different measurement requirement, and the usefulness of combining results depends on appropriate sampling, calibration, consistent reporting, and the operating information available.
For example, a mine may compare WipFrag measurements from a blast with subsequent Reflex measurements of truckloads leaving that mining area. Solo measurements can then provide information about material entering or leaving a processing stage.
When these results are associated with their locations, times, sources, and operating conditions, they can help explain how material characteristics change as production progresses.
Evaluating Trends and Operational Changes
Long-term measurement records can also support comparisons between operating periods.
A mine might evaluate fragmentation before and after a change in blasting practices, examine crusher product size as equipment wears, or compare grinding circuit feed characteristics from different mining areas.
Measurements can be evaluated alongside operating indicators such as throughput, power consumption, equipment settings, maintenance records, and material routing.
This helps engineers investigate whether changes in material characteristics are associated with changes in process performance.
Importantly, fragmentation measurements do not directly quantify energy efficiency, equipment wear, or cost savings. Those outcomes require corresponding operational data.
The value of fragmentation measurement is that it adds material-characterization information to those evaluations, helping operators better understand the conditions influencing performance.
Building a Consistent Improvement Process
A measurement-driven improvement program begins by defining the requirements of the operation and establishing meaningful targets.
Measurements are then collected at selected locations to determine how actual material characteristics compare with those requirements.
When conditions differ from expectations, the results can be evaluated alongside the corresponding geological, equipment, and operating information.
Changes to blasting, crushing, screening, or other process settings can then be assessed using subsequent measurements.
Over time, this creates a feedback process in which operational decisions are informed by observed material behaviour rather than assumptions alone.
Not every operation needs measurement systems at every stage. A single well-placed system may provide considerable value when it addresses an important operational problem.
Other operations may benefit from combining measurements at several locations to understand how material changes as it moves through production.
The objective is to establish the right measurements, at the right locations, with a clear purpose for using the results.
Published research provides practical examples of how these measurement approaches have been applied across different operations. Studies involving SAG mill control, crusher performance, conveyor monitoring, and blast optimization demonstrate how fragmentation data can contribute to broader evaluations of process performance. Explore these applications in WipWare Case Studies: Fragmentation and Process Monitoring.
Jump to:
1. Start with the Process, Not the Measurement
•
2. Before Blasting: Understanding the Rock Mass
•
3. After Blasting: Measuring What Was Produced
•
4. From Pit to Plant: Measuring Material During Haulage
•
5. Through Processing: Continuous Conveyor Monitoring
•
•
7. Periodic Sampling and Continuous Monitoring
•
8. Turning Measurements into Process Decisions
•
9. Case Study: Connecting Blast Fragmentation to Crusher Requirements
•
10. Building Long-Term Visibility Across the Life of a Mine
•
•
Conclusion
Fragmentation affects much more than the immediate results of a blast.
Material characteristics influence loading, haulage, crushing, screening, grinding, and the consistency of downstream processing. Understanding these relationships requires measurements that can be connected to the operating decisions made at each stage.
From pre-blast rock characterization and fragmentation assessment to automated vehicle-load and conveyor monitoring, WipWare provides complementary technologies for understanding how material changes throughout an operation.
Together with appropriate sampling, operating records, and process targets, these measurements can help operations identify variability, evaluate changes, and develop more consistent approaches to process improvement.
Over the life of a mine, the resulting measurement history can provide valuable context for understanding changing material conditions, comparing operating strategies, and informing future decisions.
The value is not simply in collecting more information. It is in understanding what the measurements mean and using them to make better-informed decisions.
Because you can’t manage what you can’t measure!
Jump to:
1. Start with the Process, Not the Measurement
•
2. Before Blasting: Understanding the Rock Mass
•
3. After Blasting: Measuring What Was Produced
•
4. From Pit to Plant: Measuring Material During Haulage
•
5. Through Processing: Continuous Conveyor Monitoring
•
•
7. Periodic Sampling and Continuous Monitoring
•
8. Turning Measurements into Process Decisions
•
9. Case Study: Connecting Blast Fragmentation to Crusher Requirements
•
10. Building Long-Term Visibility Across the Life of a Mine
•
 WipWare