


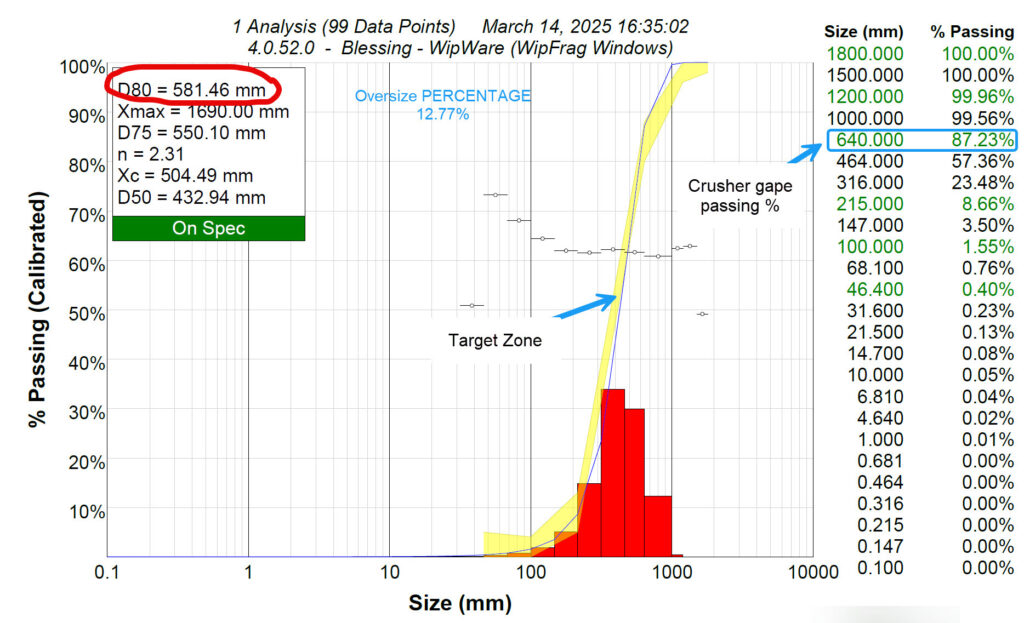
In crushing and mineral processing, particle size distribution (PSD) is an important measure of how material behaves as it moves through an operation. One of the most widely used indicators is P80, which describes the particle size at which 80% of the material passes.
P80 helps engineers evaluate crushing and grinding performance, establish product size targets, and understand how material characteristics change between processing stages. However, it is only one part of the particle size distribution, and its usefulness depends on how it is measured and applied.
What Is P80?
P80 is the particle size at which 80% of the material passes, typically expressed as a percentage of mass.
For example, if crushed ore has a P80 of 120 mm:
- Approximately 80% of the material, by mass, is smaller than 120 mm.
- Approximately 20% is larger than 120 mm.
A smaller P80 generally indicates a finer material distribution, while a larger P80 indicates a coarser distribution.
P80 is determined from the cumulative particle size distribution curve, which shows the percentage of material passing at different particle sizes.
P80, F80, and D80: What’s the Difference?
These terms describe closely related measurements, but they are commonly used in different contexts.
| Term | Meaning | Common application |
|---|---|---|
| P80 | 80% passing size of a process product | Crusher or grinding circuit output |
| F80 | 80% passing size of a process feed | Material entering a crusher or grinding mill |
| D80 | 80% passing size of a particle size distribution | General fragmentation analysis and material characterization |
For example, if material enters a crusher with an F80 of 300 mm and leaves with a P80 of 75 mm, the 80% passing size has decreased by a factor of four.
WipWare’s WipFrag software generally reports percentile sizes using D-values, including D50, D80, and D95. D80 represents the same percentile as P80, although comparisons between measurement methods must account for their sampling and analysis approaches.
For more information on reading D-values and particle size distribution curves, see the WipFrag Results Interpretation Guide.
How Is P80 Determined?
P80 is obtained from a particle size distribution. The measurement method depends on the material, particle sizes, and operating conditions.
Sieve Analysis
In conventional sieve analysis, a representative material sample is passed through a series of sieves with progressively smaller openings.
The material retained at each size is weighed, and the cumulative percentage passing is calculated. P80 is the size corresponding to 80% passing on the resulting distribution.
Sieve analysis provides a direct mass-based measurement but may require material collection, handling, and laboratory processing.
Image-Based Particle Size Analysis
Image-based methods estimate particle size distributions by identifying and measuring particles visible in digital images.
WipWare technologies support several measurement approaches:
- WipFrag analyzes photographs collected in the field, laboratory, underground, or by UAV.
- Reflex provides automated measurements of vehicle loads or material during discharge.
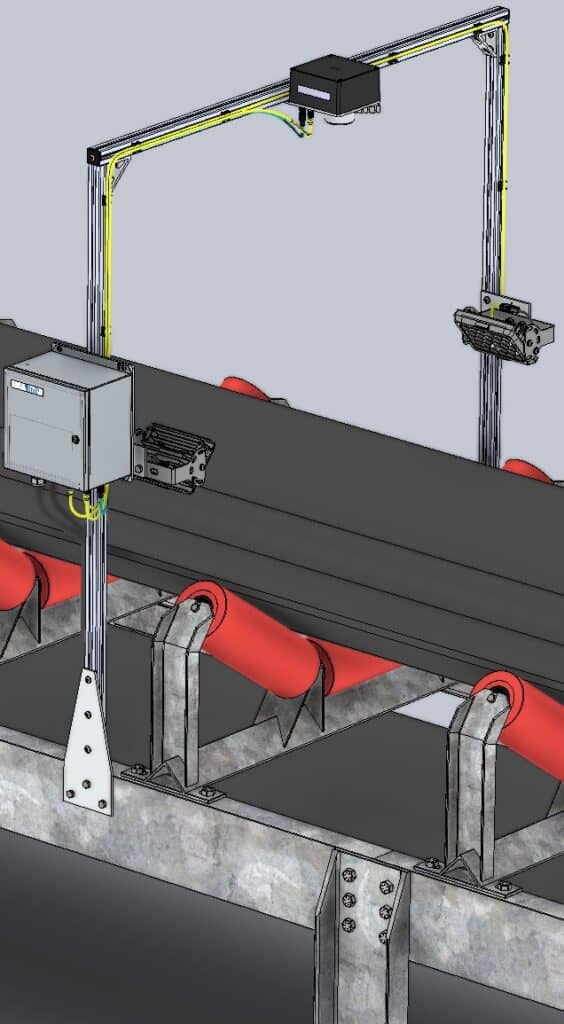
- Solo provides repeated measurements of material moving on conveyors and process lines.
The Complete configurations of Solo and Reflex provide PSD measurements, while their Basic configurations focus on maximum particle size and colour monitoring.
Unlike physical sieving, optical measurements are derived from visible particles and associated size-estimation methods. Particles that are buried, obscured, or too small to resolve cannot be directly measured from the image.
Where appropriate, calibration and representative physical sampling can help relate optical results to the overall material distribution.
Why Is P80 Important in Crushing and Mineral Processing?
1. Crusher Performance and Product Size Control
Crushers are designed to reduce material to sizes suitable for downstream equipment.
Monitoring P80 can help operations evaluate whether crusher output is becoming coarser or finer, compare performance under different operating conditions, and assess the effect of changes to crusher settings.
For example, a change in P80 following an adjustment to a crusher’s closed-side setting (CSS) may indicate a change in product size.
However, P80 alone does not establish whether material is suitable for the next process. A relatively small proportion of oversized particles may still cause problems even when the overall P80 meets its target.
Maximum particle size, higher percentile sizes, and the percentage of material above specific thresholds may therefore be equally important.
2. Grinding Circuit Efficiency
In grinding circuits, the relationship between feed size and product size helps determine the energy required for size reduction.
A common expression of this relationship is the Bond equation:
W = 10 × Wi × (1/√P80 − 1/√F80)
Where:
- W is the estimated specific energy required, typically in kWh/t.
- Wi is the Bond Work Index.
- F80 is the 80% passing size of the feed.
- P80 is the 80% passing size of the product.
In the conventional form of the equation, F80 and P80 are expressed in micrometres (µm).
The Bond Work Index is determined through standardized testing or other appropriate characterization methods; it is not calculated from F80 and P80 alone. The equation provides an estimate of grinding energy requirements, and practical applications may require additional correction factors.
The accuracy of grinding energy estimates also depends on the Bond Work Index used. Sample preparation, particle size, and testing methodology can influence its determination. Nikolić and Trumić (2021) examined these considerations for finer samples, highlighting the importance of appropriate methods when determining the Bond Work Index.
Generally, producing a finer product from the same feed requires additional grinding energy. The objective is therefore not always to minimize P80, but to achieve the particle size needed for the subsequent process without unnecessary energy consumption.
3. Mineral Liberation and Recovery
Many mineral processing operations require valuable minerals to be sufficiently liberated from surrounding material before separation.
If grinding produces material that is too coarse, valuable minerals may remain locked within larger particles. If material is ground more finely than necessary, additional energy is consumed, and excessive fines may create problems for some separation processes.
The appropriate P80 depends on the ore’s mineralogy, liberation characteristics, and downstream processing requirements.
P80 provides a useful operating reference, but it does not directly measure mineral liberation or recovery.
4. Crusher Feed Compatibility and Throughput
Material entering each processing stage must be suitable for the equipment receiving it.
Coarse or highly variable feed can affect crusher loading, throughput, and equipment performance. Conversely, excessive fines or material outside the preferred feed distribution can also influence how effectively equipment operates.
Monitoring feed size distributions helps identify changing conditions before they become persistent processing problems.
P80 is useful for tracking the general coarseness of the feed, while additional PSD measurements can help identify problematic oversize or fines.
5. Process Control and Optimization
Repeated particle size measurements can help operations understand whether material is remaining within an acceptable operating range.
Depending on the process, the information may support:
- Evaluation of crusher setting adjustments.
- Monitoring of crusher feed and discharge conditions.
- Identification of changes in screening performance.
- Assessment of grinding circuit feed variability.
- Comparison of material from different sources or operating periods.
For suitable conveyor applications, Solo Complete provides automated PSD measurements that can be used to monitor P80 and other particle size indicators as material moves through the process.
For an explanation of how fragmentation measurements can be applied across multiple processing stages, see From Blast to Mill: Using Fragmentation Data to Improve Mining Performance.
Published studies have also examined how particle size measurements relate to crusher productivity, grinding performance, and process stability. For practical examples of these applications, see WipWare Case Studies: Fragmentation and Process Monitoring.
How Does P80 Change Between Process Stages?
P80 can be measured at several locations within a crushing and grinding circuit, but there is no universal target for every stage.
| Process stage | How P80 can be used |
|---|---|
| Primary crushing | Evaluate coarse product size and changes in crusher performance |
| Secondary crushing | Monitor additional size reduction and downstream feed consistency |
| Tertiary crushing | Assess finer product size and compliance with process requirements |
| Grinding mill feed | Characterize incoming material and changes in feed size |
| Grinding circuit product | Evaluate whether the material has reached the required fineness for downstream processing |
The appropriate size range depends on equipment design, material properties, and the intended product.
Just as importantly, the measurement technology must be suitable for the relevant particle sizes.
For example, automated optical analysis of coarse material on a conveyor has different measurement requirements from evaluating a finely ground product containing particles measured in micrometres.
See Understanding Size Ranges in Conveyor Belt Analysis for an explanation of how field of view, camera resolution, and installation geometry influence detectable particle sizes.
Factors That Influence P80
Particle size distribution can change for many reasons, including variations in the material itself and adjustments to the process.
Important influences include rock hardness and geological characteristics, blast fragmentation, crusher settings, equipment wear, feed rate, screening performance, and operating conditions.
For mining operations, variation can begin before material enters the processing plant. Changes in geology or blasting conditions may influence the size distribution delivered to the primary crusher.
Our guide to Understanding Rock Blasting and Fragmentation explores the conditions and blast-design variables that influence the initial fragmentation of rock.
Because these factors can interact, a change in P80 should be treated as an indication that the material distribution has changed—not automatic proof of a particular cause.
Why P80 Should Not Be Used Alone
Although P80 is an important measurement, two materials with the same P80 can have substantially different particle size distributions.
One may contain more fines, while another may have a greater concentration of oversized particles.
For more complete process evaluation, P80 can be considered alongside:
- Other percentile sizes, such as D50 or D95.
- Maximum particle size, especially where oversize presents a risk.
- Percentage passing or retained at a defined size, such as a screen opening or process threshold.
- The complete PSD curve, including changes in distribution shape.
- Specification envelopes, where the process has defined acceptable particle size limits.
The appropriate combination depends on what the operation needs to control.
For example, a crusher may require a maximum feed size limit in addition to an acceptable P80 range. A grinding circuit may need to monitor both overall feed coarseness and changes in fines content.
The most useful measurements are those that connect directly to an operational decision.
Conclusion
P80 provides a practical way to describe and compare particle size distributions throughout crushing and mineral processing.
It helps operations evaluate size reduction, establish process targets, monitor material variability, and understand the relationship between feed characteristics and downstream requirements.
However, an appropriate P80 is not necessarily the smallest achievable value. It is the value that supports the requirements of the process.
When combined with other PSD measurements, representative sampling, and relevant operating information, P80 becomes a more useful indicator of process performance.
WipWare provides tools for measuring particle size distribution through field analysis, vehicle monitoring, and automated conveyor measurement.
Explore our measurement technologies or contact WipWare to discuss the particle size measurements most relevant to your operation.
References
Nikolić, V., & Trumić, M. (2021). A new approach to the calculation of Bond work index for finer samples. Minerals Engineering, 165, 106858.
 WipWare