By: Mark Wagner
WipWare has been in the image analysis business for about 20 years commercially, so we’ve seen a wide range of mining and aggregate sites, all with their unique challenges. One thing that stays consistent with every operation is the need to reduce particle sizes to ideal sizes for either the extraction of minerals, or for more practical uses (road building, etc.)
Blasting, crushing and grinding material down to an optimal size is difficult to do, and when you tie in trying to be efficient at the same time, production rates can fluctuate quite easily. It’s very hard to track how well the ‘rock breaking’ is going.
Queue sieving!
Manual sieving has been around for thousands of years. Nowadays, the accuracy of these sieve analysis methods is quite impressive: stop your belt, take a cut, bring material to the lab, put it in the sieve shaker, and voila! In a few hours you have your result. What could be better?
Well, let’s back it up a little and investigate: manual sieve samples are very accurate for the sample itself; however, if you use manual sampling to track, say, relative changes, you are putting a lot of faith in that one belt cut of material representing hundreds/thousands of tons of material.
You may begin to notice why WipWare systems are really taking a hold in the mining and aggregate industries: No one will ever argue that a manual sample that is sieved is not accurate; but here is a scenario I want you to consider:
You take a sample of a 1 meter belt cut every shift for analysis. When the crusher supplier asks for the material size going into the secondary crusher, you hand him/her the beautiful distribution curves with the data points in the Excel file. Based on the data, he/she decides “based on your material size, you need this kind of crusher/liner/product”.
Do those manual samples accurately represent the hundreds or thousands of tons passing through your process? What if the sample you took happened to be finer than what was typical? Chances are, as granulometry guru Jack Eloranta, of Eloranta & Associates calculates, misrepresentation could be possible. Take a look:
Assume:
400 TPH
6 m/s
1 meter belt sample per shift
Belt travels 1 meter in 0.17 seconds
0.17 sec x 1 hr/3600 sec x 400 t/hr = .019 tons
.019 t/(8 x 400) t = .0000059
Really, when you take a look at how representative a manual sample is, you are looking at 0.00059% of your conveyor material in this example.
With a percentage like that, I’ll take continuous, non-disruptive particle sizing any day.
So let’s summarize so far: Manual sieving is accurate for the material actually being sieved, but may not adequately represent what is running through your process on a continuous basis.
What’s WipWare’s role in all of this? Well, it’s really a complementary thing. WipWare is the ying to sieving’s yang, the Sunny to sieving’s Cher…I’ll stop now.

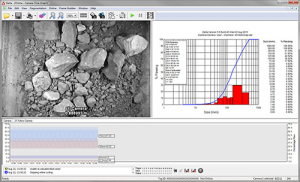
WipWare’s systems offer continuous monitoring of material. That’s right. 24/7/365 analysis of the most important part of the mining process; the whole reason billions upon billions of dollars are spent each year; the reason why mine and mill employees have a love/hate relationship – the size of material! Manual sieve results can be tied into the WipWare data using Rosin-Rammler or Swebrec functions, covering both the quantity of data needed for accurate analysis, with the quality manual sample information.
So, next time you are taking buckets of material from a conveyor belt for manual analysis, consider the benefits of having a continuous, non-disruptive system in place that will give you a better snap shot of what’s passing through your operation.