

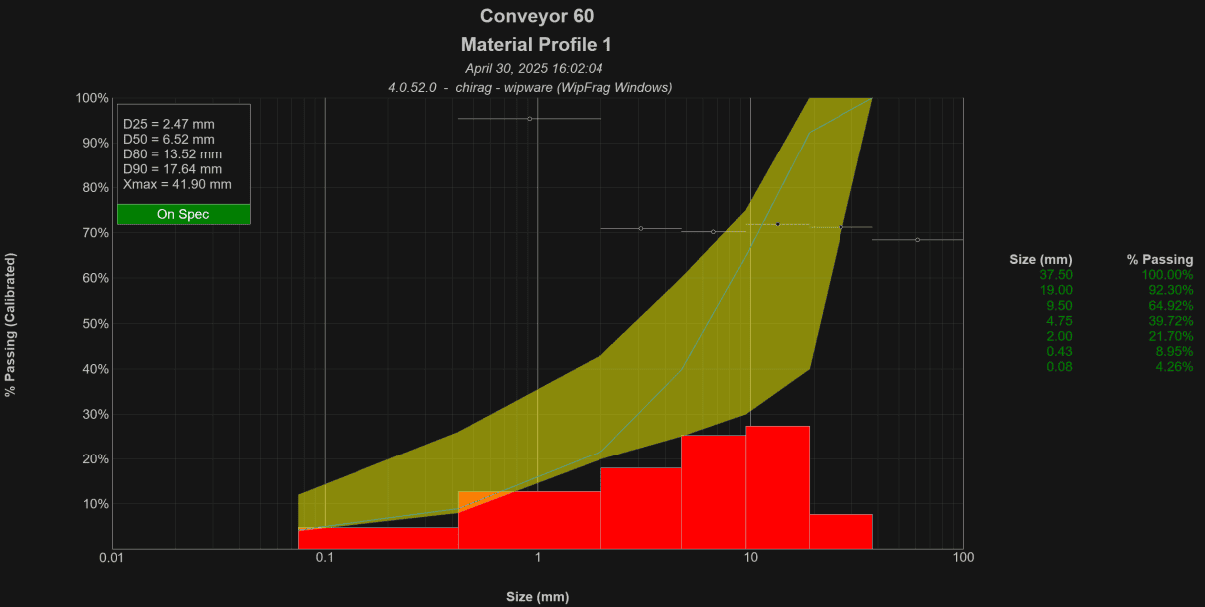
WipWare’s automated measurement systems provide repeated particle size measurements that help operations monitor material characteristics, identify changes, and make better-informed process decisions.
But how closely do image-based particle size distributions match physical sieve results? And does every system need to be calibrated?
Sieve calibration allows image-derived particle size distributions to be adjusted against laboratory results from the same material. It can improve agreement with physical sampling, particularly where fines or other material not fully represented in the images affect the overall distribution.
However, sieve calibration is not necessary for every application. Whether it adds value depends on what the operation needs to measure and how that information will be used.
Please note that sieve calibration is only used with WipWare’s Solo Complete and Reflex Complete models, which measure particle size distribution (PSD).
What Is Sieve Calibration?
Sieve calibration is the process of comparing a particle size distribution (PSD) generated through optical analysis with laboratory sieve results from a corresponding physical sample.
The laboratory determines the distribution of material across a series of known sieve openings, typically by weight. The image analysis estimates particle sizes from the material visible to the camera.
Because these methods measure material differently, their resulting distributions may not match exactly.
WipWare’s calibration tools use the two distributions to calculate mathematical adjustments that improve the relationship between the optical measurements and the physical reference.
This allows the automated system to report a calibrated PSD that more closely reflects the reference distribution under comparable operating conditions.
Why Can Optical and Sieve Results Differ?
An image-based measurement primarily represents the particles visible at the material surface. Smaller particles may be hidden beneath larger particles, overlap with neighbouring material, or be too small to distinguish individually at the available image resolution.
Physical sieving, meanwhile, measures the collected material across its full depth, including particles that were not visible to the camera.
Differences may also arise from particle shape, the way optical dimensions are estimated, material segregation, and how the physical sample was collected.
These differences do not automatically mean that either measurement method is unsuitable.
Instead, they highlight why the measurement method should be selected according to the application’s requirements.
Calibration adjusts the reported distribution; it does not improve camera resolution or make hidden particles directly visible.
For more information about the optical measurement range, see Understanding Size Ranges in Conveyor Belt Analysis.
When Is Sieve Calibration Useful?
Calibration is most useful when an operation needs its automated PSD results to agree with an established physical sizing reference.
Examples include:
- Comparing online particle size measurements with routine laboratory sieve results.
- Monitoring the percentage passing or retained at critical process-control sizes.
- Establishing PSD targets based on existing laboratory measurements.
- Evaluating changes in crusher or grinding circuit performance using a consistent reference method.
- Accounting mathematically for particle fractions that are underrepresented in surface images.
For example, a processing plant may already use laboratory sieve results to establish acceptable crusher product sizes.
Calibrating the automated measurement system against representative sieve data can help provide more frequent PSD measurements that relate to the plant’s existing reporting and control requirements.
The value comes from combining laboratory reference measurements with repeated automated monitoring.
When Is Calibration Unnecessary?
Not every process requires an absolute PSD matched to laboratory sieving.
Many operations use automated measurement to track relative changes in material size. For these applications, consistent uncalibrated measurements may provide the necessary information.
Consider a crusher discharge conveyor where the objective is to identify when material begins getting progressively coarser. Changes in the measured particle size distribution may provide an early indication of changing crusher performance, even without sieve calibration.
Similarly, an application focused on detecting particles above a maximum-size threshold may benefit more from direct oversize monitoring than from a mathematically adjusted PSD.
Calibration should therefore be considered according to the intended measurement:
| Measurement objective | Sieve calibration |
|---|---|
| Monitoring relative changes in particle size | Often unnecessary |
| Detecting maximum particle size or oversize | Generally unnecessary |
| Matching an established laboratory PSD reference | Recommended |
| Reporting calibrated passing percentages at specified sizes | Recommended where suitable reference data are available |
| Investigating fines or broader PSD characteristics | Potentially useful, subject to sampling and optical measurement limitations |
The objective is not to calibrate every system automatically, but to determine whether calibration improves the information needed for the process.
Preparing for Sieve Calibration
Before collecting calibration samples, the automated system should be properly commissioned and its imaging conditions established.
These include:
- Camera position, lens selection, and focus.
- Lighting and image exposure.
- Image scale and measurement geometry.
- Analysis settings and particle detection.
- Material presentation and operating conditions.
- The size classes and measurements required by the operation.
Calibration should not be used to compensate for poor image quality or incorrect scaling.
If the system cannot distinguish the relevant material, the imaging conditions should be addressed before attempting sieve calibration.
Changes to the camera configuration, analysis settings, or material conditions may also affect the validity of an existing calibration.
Choosing the Right Sieves
Laboratory test sieves should comply with an appropriate recognized standard, such as ASTM E11 or ISO 3310-1, as determined by the operation’s laboratory or Process Control Department.
The selected sieve openings should cover the expected material size range, including the largest relevant particles and the finer fractions.
Particular attention should be given to sizes used for operational decisions, such as crusher specifications, screen apertures, or other process-control thresholds.
The laboratory report should include:
- Sieve opening sizes and units.
- Weight retained on each sieve, including the pan.
- Cumulative percentage passing at each sieve size.
The complete material distribution is important. Excluding larger particles simply because they exceed the primary size range of interest can distort the resulting comparison.
System Sieve Calibration Procedure
The following procedure summarizes the approach used in WipWare’s current system commissioning documentation. The exact collection method and software controls depend on the installation and system configuration.
Step 1 — Establish Normal Operating Conditions
Begin with the system operating under representative production conditions.
The material should reflect the feed characteristics, loading conditions, and size distribution that the system will normally encounter.
Avoid performing calibration during unusual operating conditions, such as a temporary process interruption, abnormal loading, or an unrepresentative material change.
Step 2 — Capture a Representative Image
Use the system’s live camera view to capture an image of the material selected for physical sampling.
The image should be clear, correctly scaled, and representative of the material that will be collected.
For a conveyor installation, the material is typically imaged after the conveyor has been brought to a controlled stop with its normal load present, following the site’s approved safety procedures.
Identify a clearly defined sampling area that can be matched to the captured image.
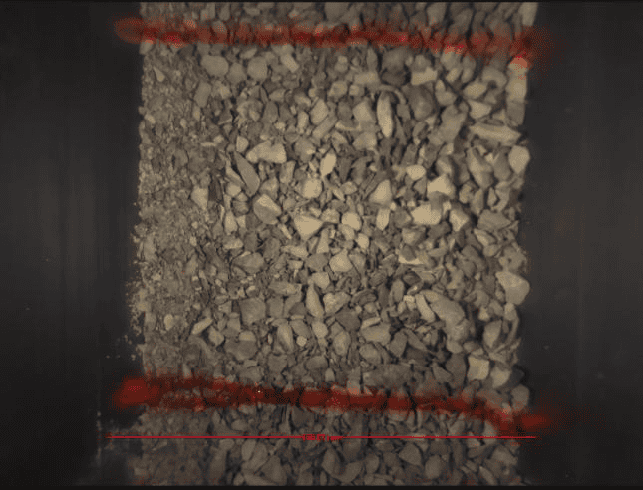
The image and physical sample must represent the same material.
Step 3 — Collect the Physical Sample
Collect the material corresponding to the imaged sampling area.
For a marked conveyor sample, this means collecting the complete depth of material within the selected area, including the fines and smaller particles beneath the visible surface.
The objective is to establish a direct comparison between the image-derived PSD and the physical distribution of that same sample.
Sample collection, equipment access, and conveyor isolation must follow site-approved safety procedures.
Where the full sample cannot be processed directly, any laboratory subsampling method should be documented and its representativeness evaluated before using the results for calibration.
Step 4 — Obtain Laboratory Sieve Results
Submit the material for laboratory sieve analysis using the selected sieve series.
The laboratory should report the mass retained and cumulative percentage passing at each sieve size.
Confirm that the complete sample has been accounted for and that the reported units and size classes are suitable for comparison with the optical analysis.
Step 5 — Analyze the Corresponding Image
Open the saved camera image in WipFrag’s Analysis View.
Define the Area of Interest (AOI) so that it includes only the material collected for physical analysis.
Review the image scale and particle boundaries before generating the uncalibrated particle size distribution.
This step establishes the original optical measurement that will be compared with the laboratory reference.
Step 6 — Enter the Sieve Reference
From the analysis results, open the calibration tools and select Sieve Target.
Enter the laboratory sieve opening sizes and corresponding cumulative passing percentages.
Ensure the units and size classes are correctly matched.
WipFrag can then evaluate calibration using the available Rosin–Rammler and Swebrec distribution models.
Step 7 — Review and Apply the Calibration
Compare the available calibration results and select the model that provides the more appropriate agreement with the laboratory reference.
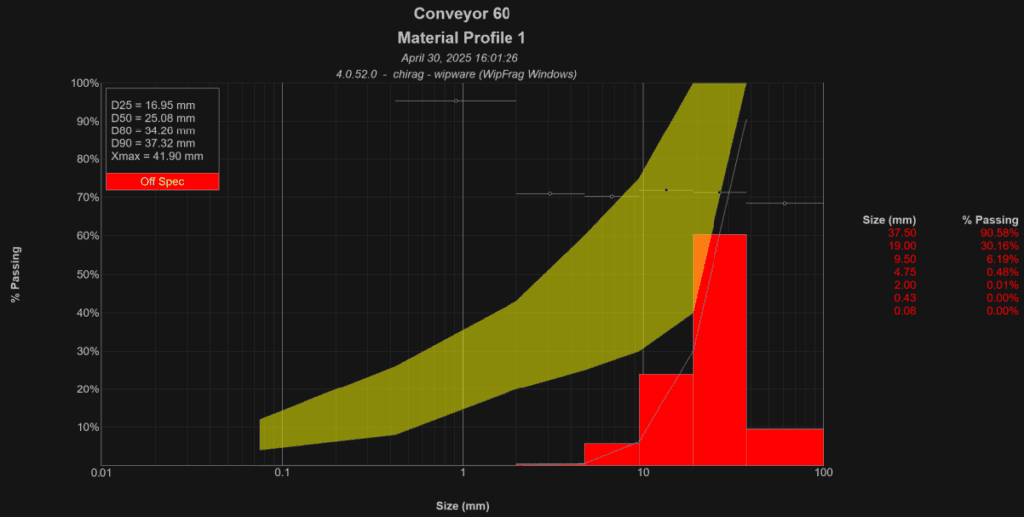
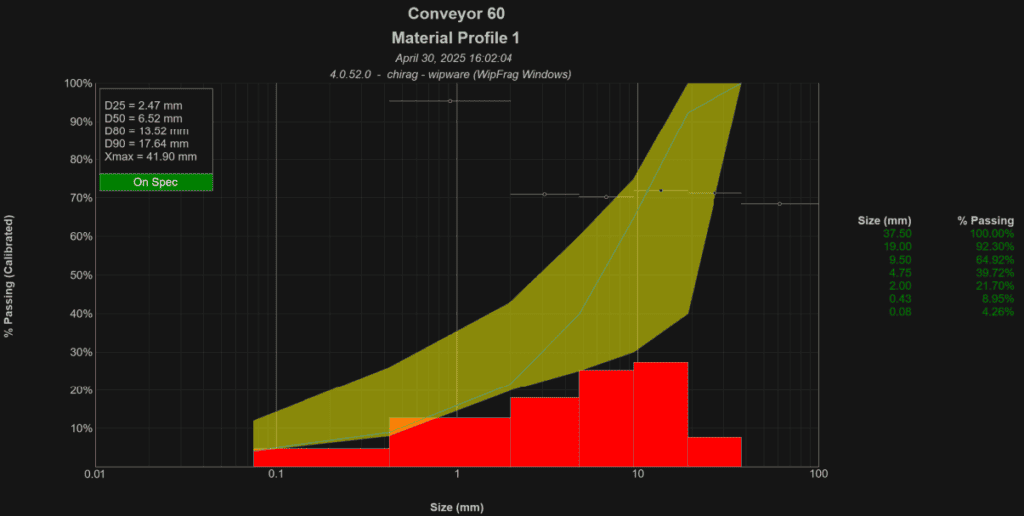
The selected calibration parameters can then be applied to the relevant system configuration using its calibration settings.
Synchronize the updated settings and review the resulting PSD.
Do not select a calibration model solely because it produces a smoother-looking curve. The objective is meaningful agreement with the physical reference.
Step 8 — Validate the Results
After applying calibration, compare additional measurements against independent laboratory reference samples where practical.
Pay particular attention to the particle size classes that matter most to the operation.
A calibration that agrees with the original sample does not necessarily guarantee the same agreement across all subsequent material conditions.
Record the sample identification, laboratory results, selected calibration model, calibration parameters, and relevant system settings.
This provides a baseline for future validation and troubleshooting.
Rosin–Rammler and Swebrec: What’s the Difference?
WipWare supports two mathematical distribution models commonly used to describe fragmented material.
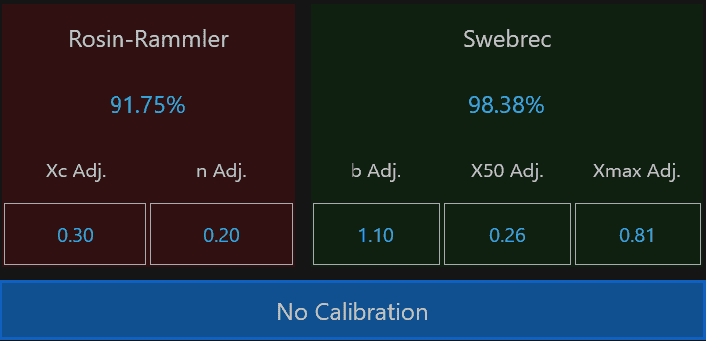
Rosin–Rammler describes a particle size distribution using characteristic size (Xc) and uniformity (n) parameters. It has a long history in fragmentation and comminution analysis. Rosin–Rammler is often useful for material with no determinable maximum size, such as uncrushed, run-of-mine materials.
Swebrec provides another mathematical representation of particle size distributions, using parameters related to median size, maximum size, and distribution shape. Swebrec is often useful for material with a determined maximum size, such as crushed or screened materials.
However, rather than assuming that one model is universally better for a particular industry or material, review how each fitted distribution agrees with the laboratory reference over the relevant particle size range before choosing which model to apply.
The selected model should support the application’s measurement objectives, NOT simply achieve an attractive graph.
How Long Does a Calibration Remain Valid?
There is no universal time interval after which every system must be recalibrated.
Calibration remains useful while the relationship between the image measurements and the material being monitored remains sufficiently consistent.
Revalidation may be warranted following changes to:
- Camera position, optics, image scale, or lighting.
- Particle detection or other analysis settings.
- Material type, composition, or size distribution.
- Loading depth, segregation, or material presentation.
- Process conditions that substantially affect the measurements.
A change does not necessarily mean the system must be immediately recalibrated. However, significant changes should prompt a review of the existing reference and whether it remains representative.
Periodic comparisons with laboratory results can help establish whether a calibration continues to meet the operation’s requirements.
What Sieve Calibration Cannot Do
Sieve calibration is a mathematical adjustment based on physical reference data. It is not a substitute for representative sampling, appropriate image resolution, or good installation design.
It cannot directly identify particles hidden beneath the material surface or distinguish individual particles that are too small to resolve in the source image.
It also cannot guarantee that the relationship established during calibration will remain valid if material characteristics or imaging conditions change significantly.
These limitations are why calibration should be supported by appropriate image collection, representative physical sampling, and periodic validation.
Making Calibration Work for Your Process
The decision to calibrate should begin with the measurement objective.
If an operation primarily needs to track changes in fragmentation or detect oversize, uncalibrated measurements may provide all the information required.
If the application depends on particle size distributions that correspond to laboratory sieve results, calibration may provide a useful connection between periodic physical sampling and automated monitoring.
WipWare’s Solo and Reflex systems provide measurement capabilities for different material-handling applications.
For more information about how automated measurements can support operational decisions, see From Blast to Mill: Using Fragmentation Data to Improve Mining Performance.
For detailed commissioning procedures and software-specific calibration settings, refer to the current WipWare system documentation or contact WipWare for technical assistance.
Because you can’t manage what you can’t measure!
 WipWare