Are you new to photoanalysis technology? Perhaps you have an installation, and would like to investigate other locations to improve efficiencies? Read on past the jump for some of WipWare’s most popular locations.
Where would be an ideal location to install your technologies?
There are 5 main locations where photoanalysis technologies are installed, all of which have a similar theme of analyzing material after it has been reduced in size. I’ve listed a few (of the many) popular locations, from the mine to the mill:
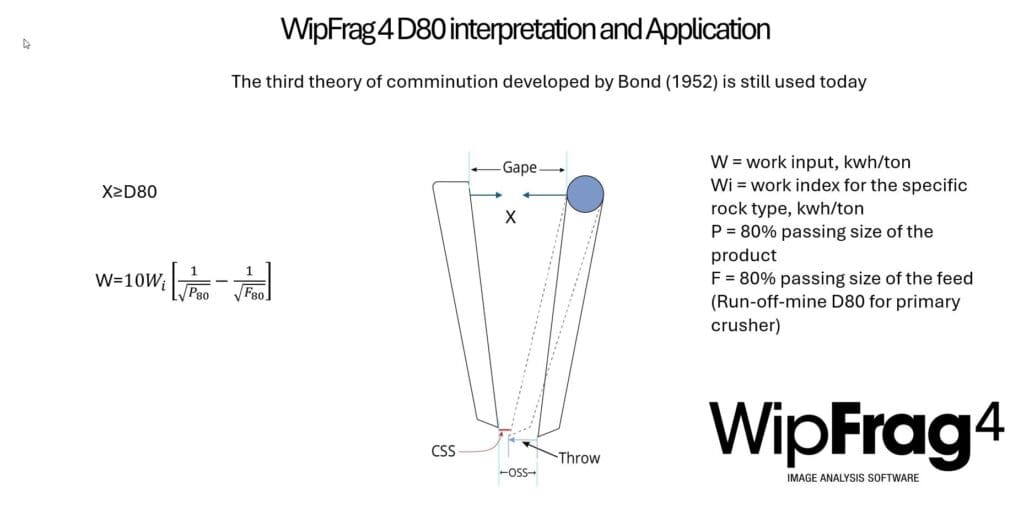
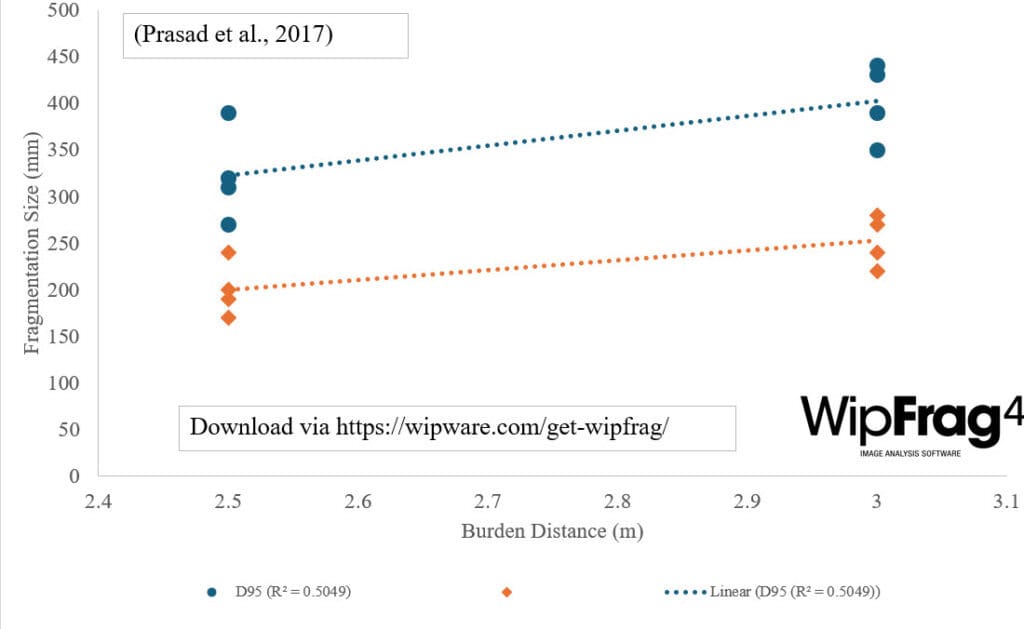
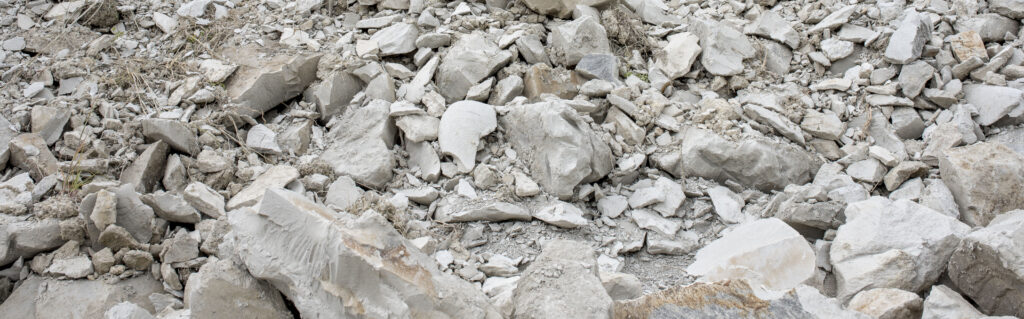
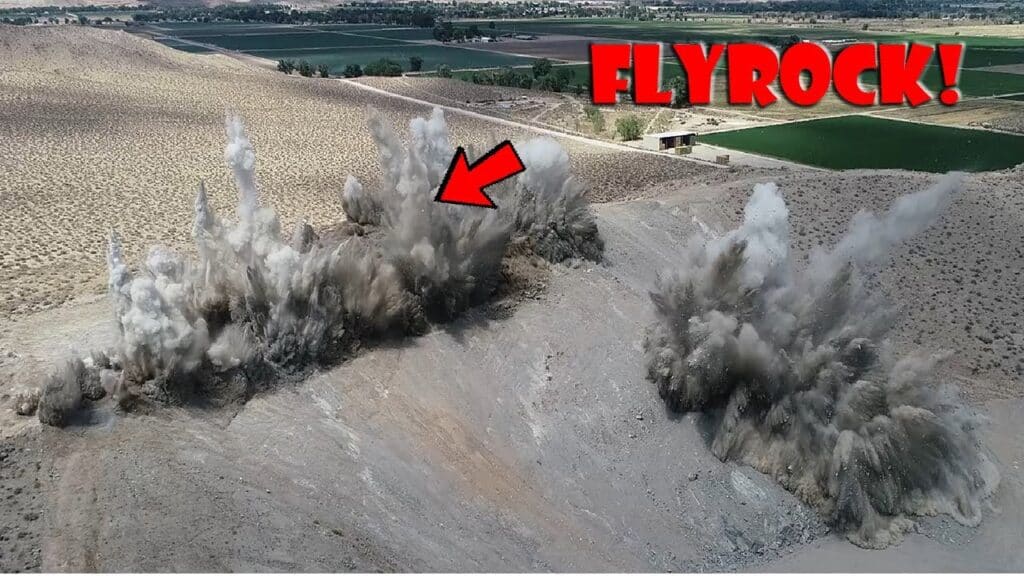
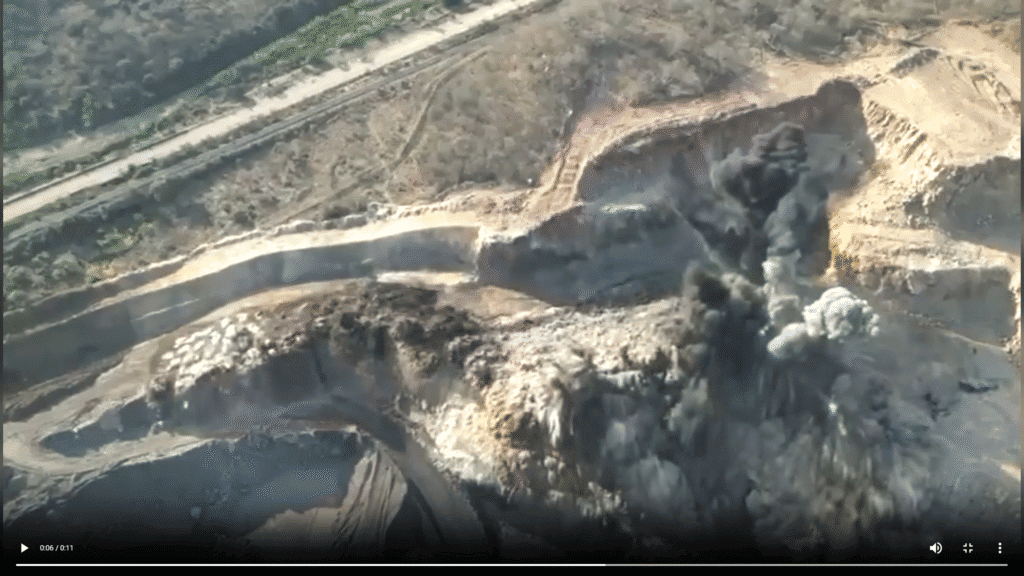
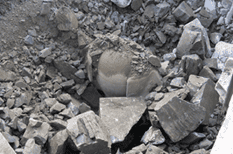
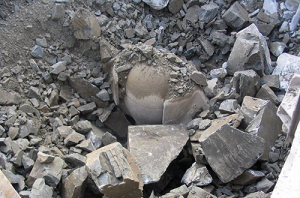
Blast Fragmentation
Unlike conveyor belt technologies, blast fragmentation systems are providing particle sizing data that would otherwise be unquantifiable. As an example: When mine team is asked how they were determining blast performance, they responded with: “Well, we try to compare it just by looking at it”. By putting quantifiable values beside the material being dumped into the primary crusher, we eliminate any bias and baseline the blasting performance.
Now, think for a second how much cheaper it would be, if you could do most of your material breaking in the blasting phase: Reduced crusher needs, less maintenance on equipment, and significantly reduced energy costs to name a few of the benefits of optimizing blasting procedures.
Post-primary/Post-secondary crusher
Either Jaw, Gyratory, or Cone, whatever type of crusher you use to break down your material, if it’s primary, secondary or tertiary crushing, you should be looking into evaluating the performance of those crushers, in order to a) maximize liner life, b) make crusher gap adjustments, c) change worn out liners before oversize contaminates your stockpile, d) improve overall crusher throughput.
See, most crusher maintenance schedules are based on a fixed timeline, when many variables can affect the lifetime of the liners. Think ore hardness, size, etc.
In fact, going back to a previous blog post, you can actually begin automating that part of your process for maximum efficiency.
Screen Breakages
If you need immediate screen breakage or wearing indicators, photoanalysis technologies can detect oversize material post screening extremely well. Aggregate producers, for example, see significant value in identifying out-of-spec material immediately after a screen failure has been identified.
SAG Optimization
This is probably the location with the biggest potential return on investment, and is the most common first installation: Imagine controlling your stockpile blend based on continuous particle sizing information. Being able to optimize SAG feed can save an operation significant cost in a variety of areas.
Know when to feed from the coarser sides of the stockpile, or from the middle.
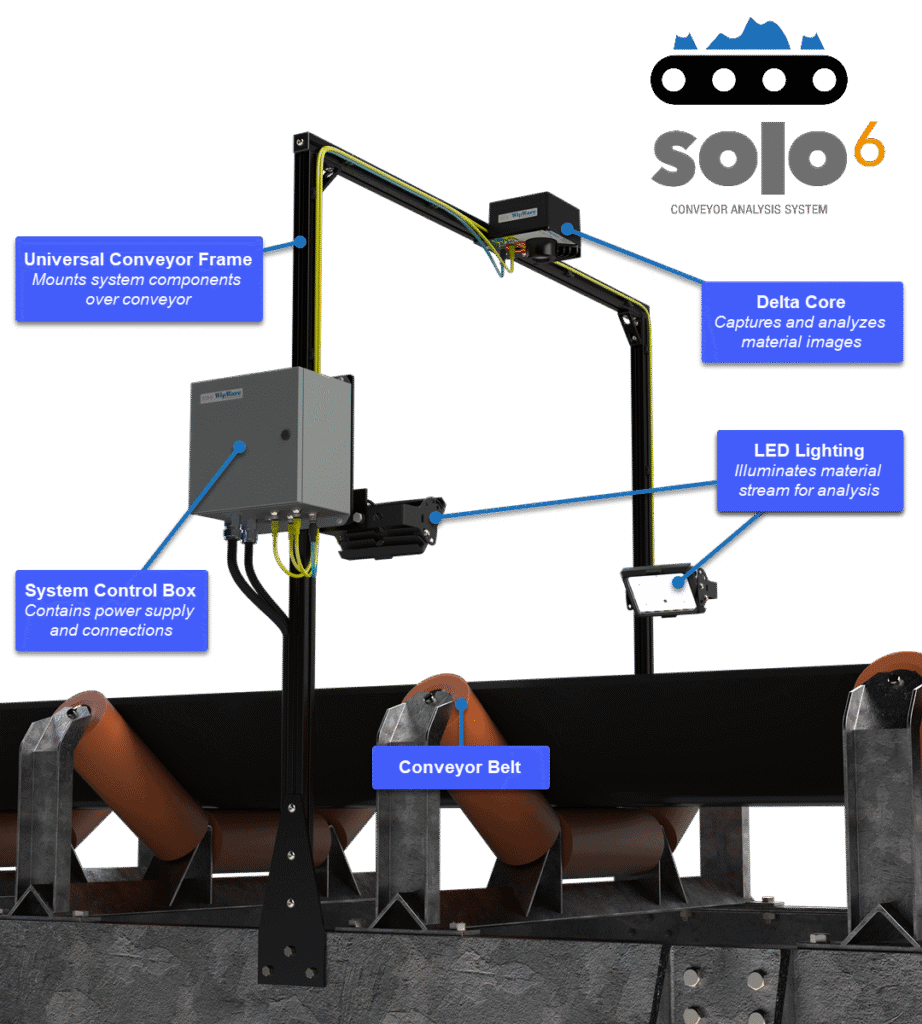
Want to read more about our conveyor analysis systems? Click here: https://wipware.com/products/solo-conveyor-analysis-system/
Looking for more information: See our Blast Fragment Optimization LinkedIn Page: https://www.linkedin.com/groups/12895040/