Fragmentation analysis is a critical driver of mine performance, profitability, and sustainability. Accurate measurement and control of rock fragmentation from drill and blast to crushing and milling directly influence throughput, energy consumption, equipment wear, and operating costs.
WipWare’s fragmentation analysis solutions use advanced image processing and AI-driven technologies to deliver high-quality, real-time particle size distribution (PSD) data. This enables mining operations to optimize processes across the entire value chain, from pit to plant, while maximizing life-of-mine value.
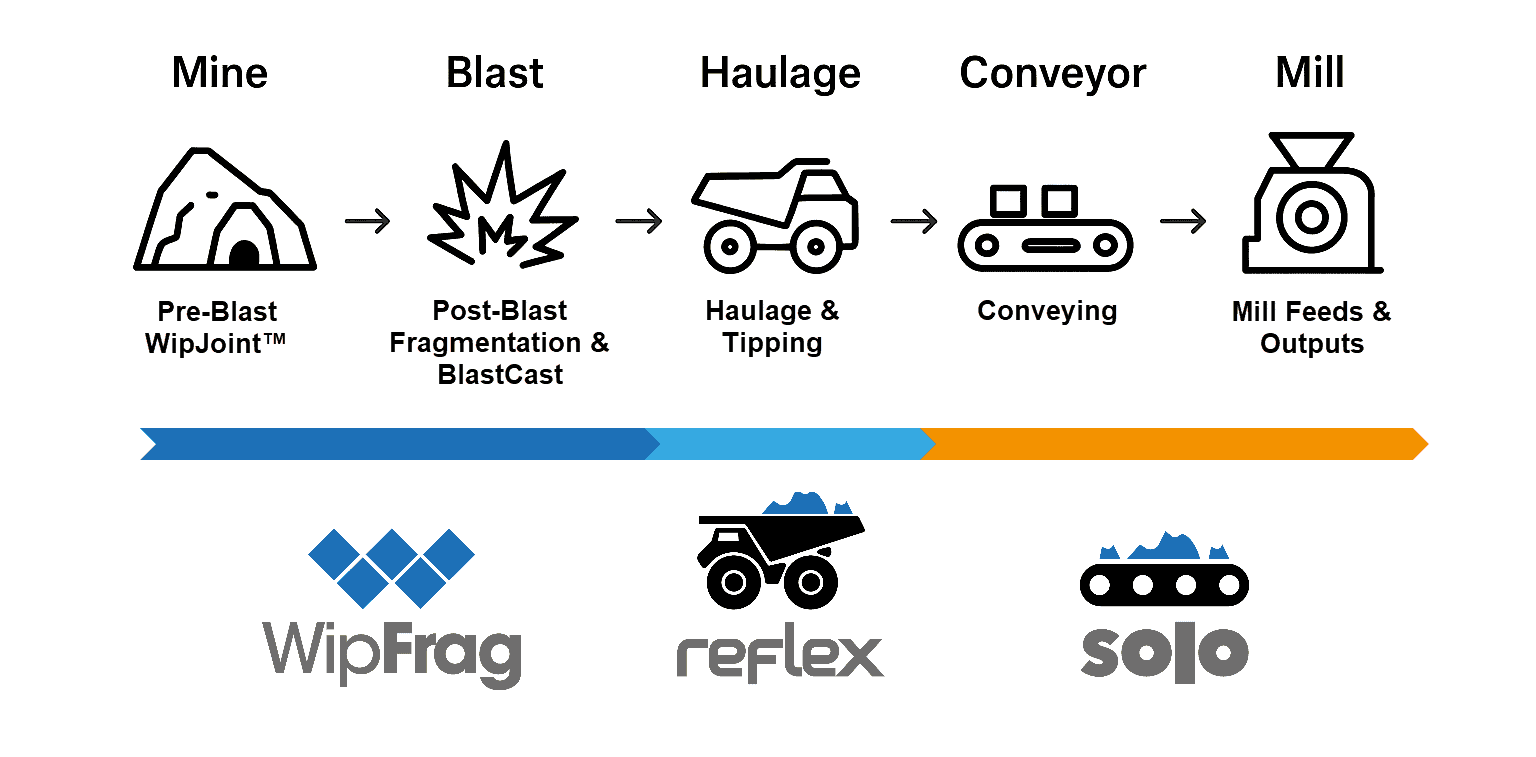
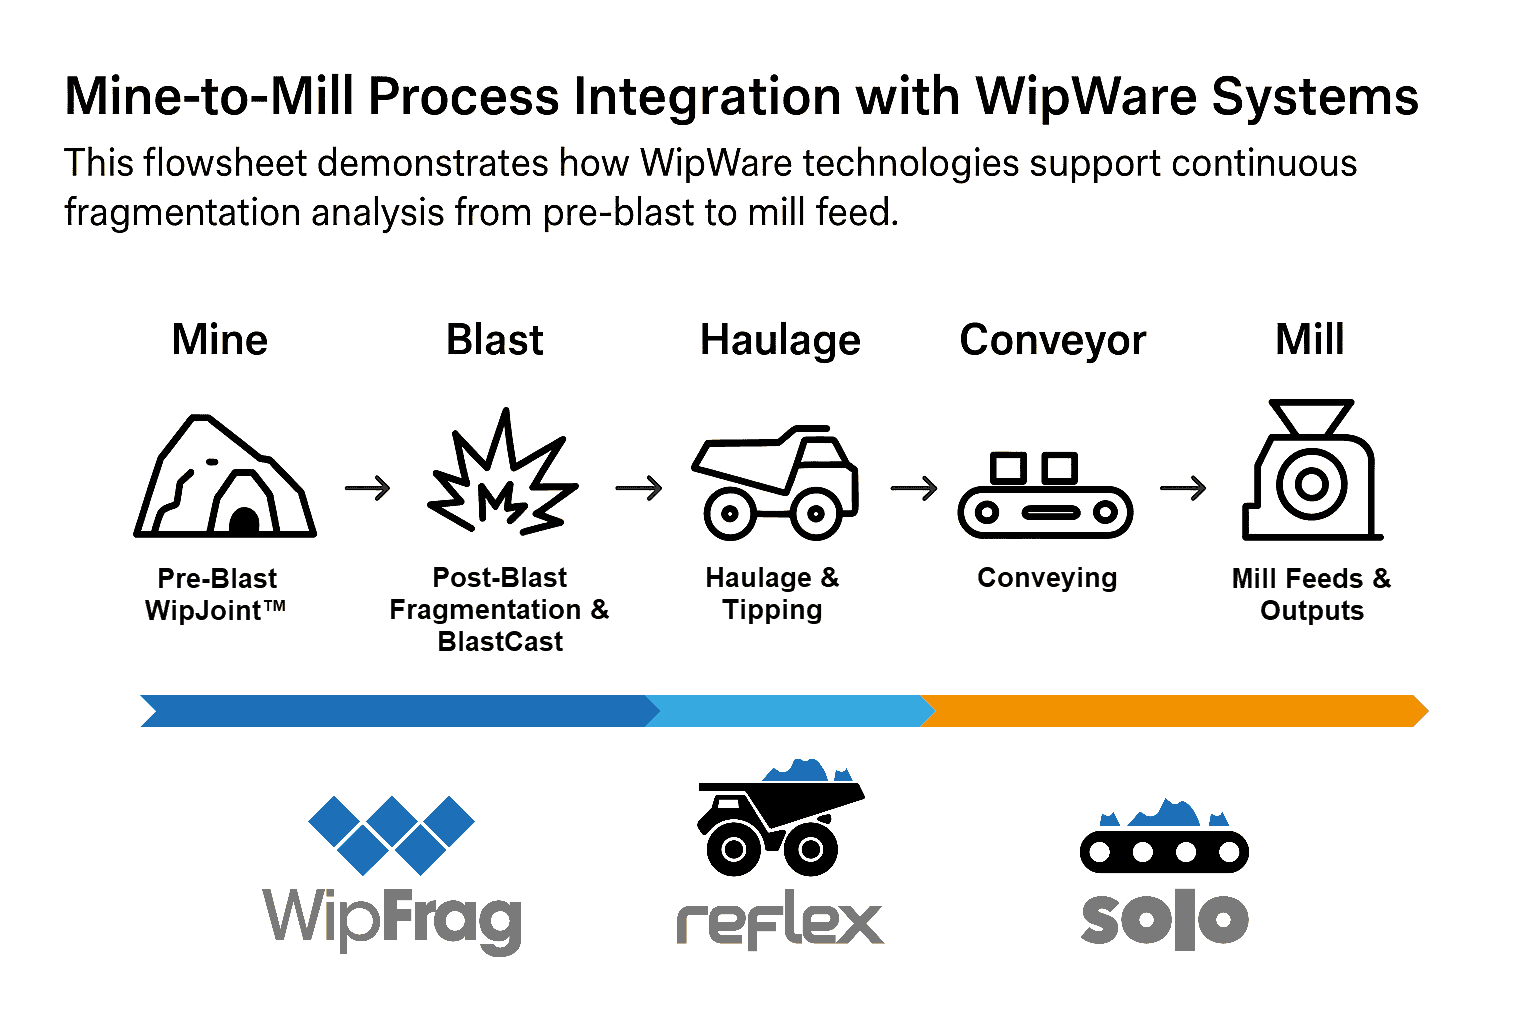
End-to-End Fragmentation Analysis: From Drill to Mill
WipWare provides a fully integrated fragmentation monitoring ecosystem, offering consistent, accurate PSD measurement at every stage of material handling. By connecting blasting performance with crushing and processing outcomes, operations gain unmatched visibility and control over their production system.
Online Conveyor Belt Fragmentation Measurement – Solo 6
Solo 6 delivers continuous, online particle size distribution analysis for conveyor belts across the comminution circuit, including:
Primary crushers
Secondary and tertiary crushers
Pebble crushers
Screen decks
With real-time fragmentation data at any conveyor belt location, Solo 6 allows operators to quickly detect changes in feed size, optimize crusher settings, and maintain consistent plant performance.
Real-Time Pit-to-Plant Fragmentation Control – Reflex 6
Reflex 6 measures the particle size distribution of post-blasted rock as it is delivered to the primary crusher, Bin and Stockpile. This real-time monitoring capability ensures effective management of the critical transition from pit to plant, reducing variability, minimizing crusher blockages, and improving overall throughput.
In-Pit Fragmentation Analysis – WipFrag 4
WipFrag is the standard industry solution for post-blast fragmentation analysis in open pit and underground mines. It enables engineers to accurately quantify particle size using:
Mobile phones
PCs
Drones (UAVs)
WipFrag provides fast, reliable fragmentation assessments directly in the pit, supporting blast design validation, performance benchmarking, and continuous improvement.
Outsourced Fragmentation Analysis – MailFrag
MailFrag is a service that offers a simple and efficient solution for teams who like to get results with the help of WipWare in-house image processing specialists. By leveraging WipWare’s experienced analysts, MailFrag delivers professional fragmentation size distribution reports, allowing operations to focus on decision-making rather than data processing.
AI-Based Geotechnical Analysis – WipJoint
WipJoint, a powerful feature within WipFrag, extends value beyond fragmentation by applying AI imaging technologies to geotechnical analysis. It supports the identification and characterization of rock mass structures, joints, and discontinuities, contributing to safer blast design and improved rock mass understanding.
BlastCast enables predictive fragmentation modeling using the Swebrec distribution, allowing engineers to simulate blast outcomes before execution. This supports:
Optimization of blast design
Reduction of oversize and fines
Alignment of fragmentation with plant requirements
Simulation-driven planning leads to improved consistency, lower costs, and better downstream performance.
Why Fragmentation Analysis Is Critical to Mine Profitability
By integrating measurement, analysis, and simulation, WipWare’s fragmentation solutions transform raw images into actionable intelligence. This holistic approach improves safety, increases productivity, reduces energy consumption, and aligns pit-to-plant performance.
Fragmentation analysis doesn’t just measure rock; it drives smarter mining decisions across the entire life of mine.
Reflex
Evaluating Rock Comminution Pre-Blast to Post-Blast and Through Mineral Processing
The Need for Energy Efficiency Assessment in Blasting
In today’s mining and quarrying operations, energy efficiency remains one of the most pressing challenges. Blasting, being the first step in the comminution process, consumes a significant portion of total energy in mineral production. Yet, the true measure of blasting efficiency is not merely how rock is broken, but how well the resulting fragmentation supports downstream processes such as crushing and grinding.
A tool is therefore needed to assess and quantify the energy utilization in blasting, specifically through fragmentation analysis. By analyzing fragmented rock sizes in terms of percentage passing, engineers can evaluate how effectively a particular blast design converted explosive energy into rock breakage. Since controllable parameters such as burden, spacing, charge distribution, and initiation timing govern how explosive energy is distributed within the rock mass, understanding fragmentation helps determine how these parameters interact with uncontrollable factors like rock structure and discontinuities.
WipWare: The Global Ruler for Rock Size Assessment
WipWare Inc. is well known as the world leader in rock size measurement and fragmentation analysis. Known as the ruler for rock size assessment, WipWare provides innovative tools that quantify particle size distributions (PSD) from pre-blast through post-blast and into mineral processing stages, creating a continuous feedback loop for process optimization.
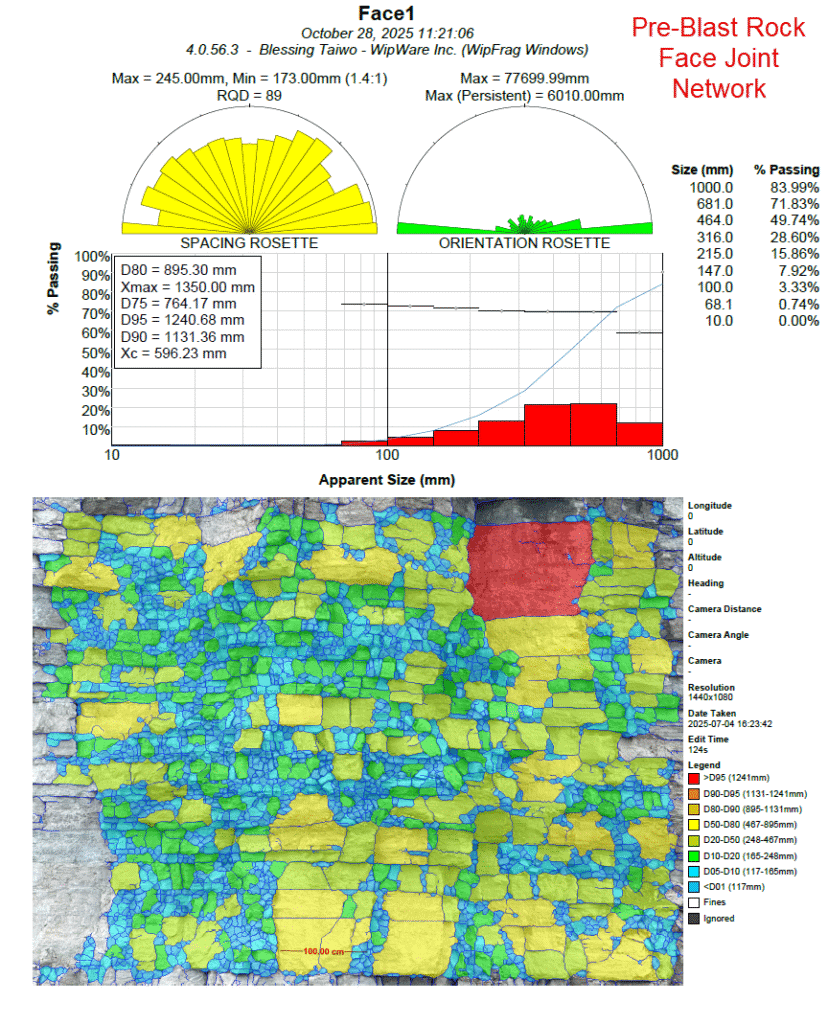
Pre-Blast Assessment with WipJoint
Understanding the geological conditions before blasting is crucial for predicting fragmentation outcomes. To bridge the gap between rock mass discontinuity and fragmentation potential, WipWare re-introduced WipJoint, a technology developed in 1990 by Dr. Norbert Maerz, Dr. John Franklin, and Dr. Tom Palangio.
WipJoint enables users to assess rock joint apparent spacing, apparent orientation, RQD and apparent in-situ block size from digital images of rock faces. This pre-blast information is invaluable for correlating structural conditions with post-blast fragmentation results. By analyzing joint characteristics, mining engineers can refine their blast design to ensure optimal energy distribution within the rock mass, thereby improving fragmentation and reducing energy waste in subsequent comminution stages.
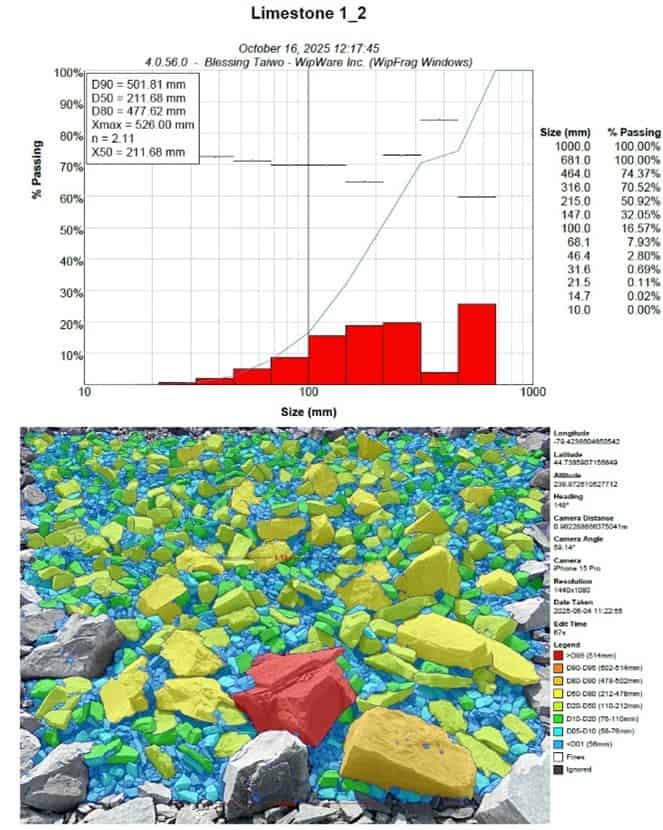
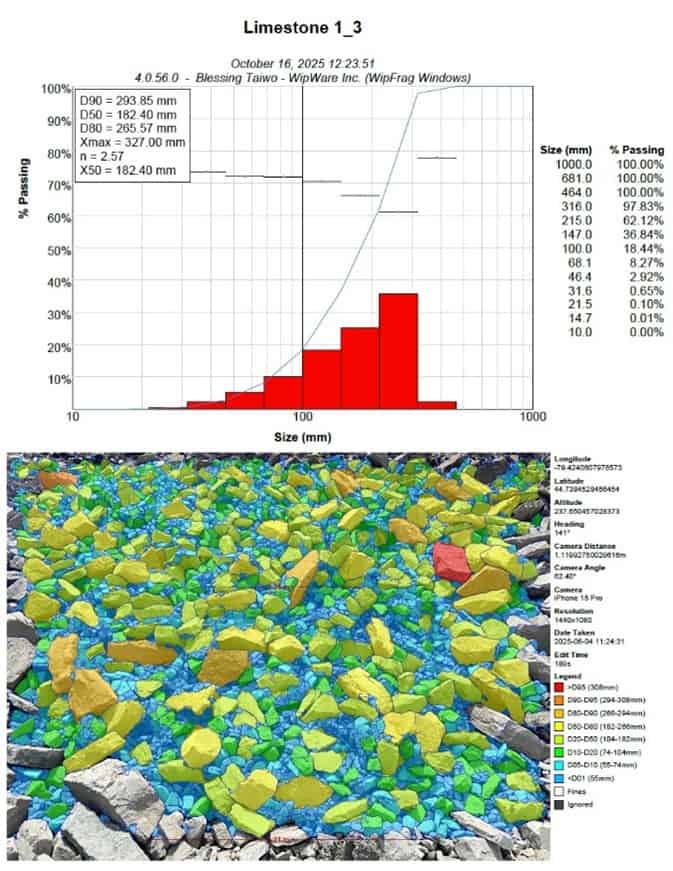
Post-Blast Fragmentation Analysis with WipFrag
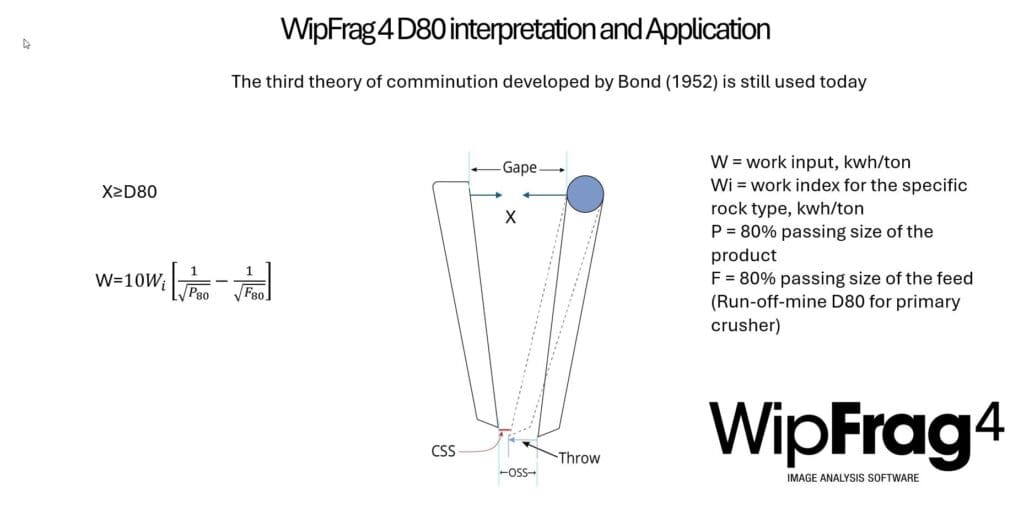
Once blasting is completed, WipFrag provides the most reliable and efficient means for evaluating fragmentation results. Using advanced image analysis, WipFrag calculates the particle size distribution (PSD) of fragmented rock piles and compares the results to target sizes such as the primary crusher’s gape.
This capability allows for quantitative comparison between different blast designs, helping to identify which parameters yield the best fragmentation for energy efficiency and crusher compatibility. With tools like specification envelopes and boulder detection, WipFrag makes it possible to assess whether the blast produced the desired material size and shape for downstream processes.
Material Assessment During Haulage with Reflex 6
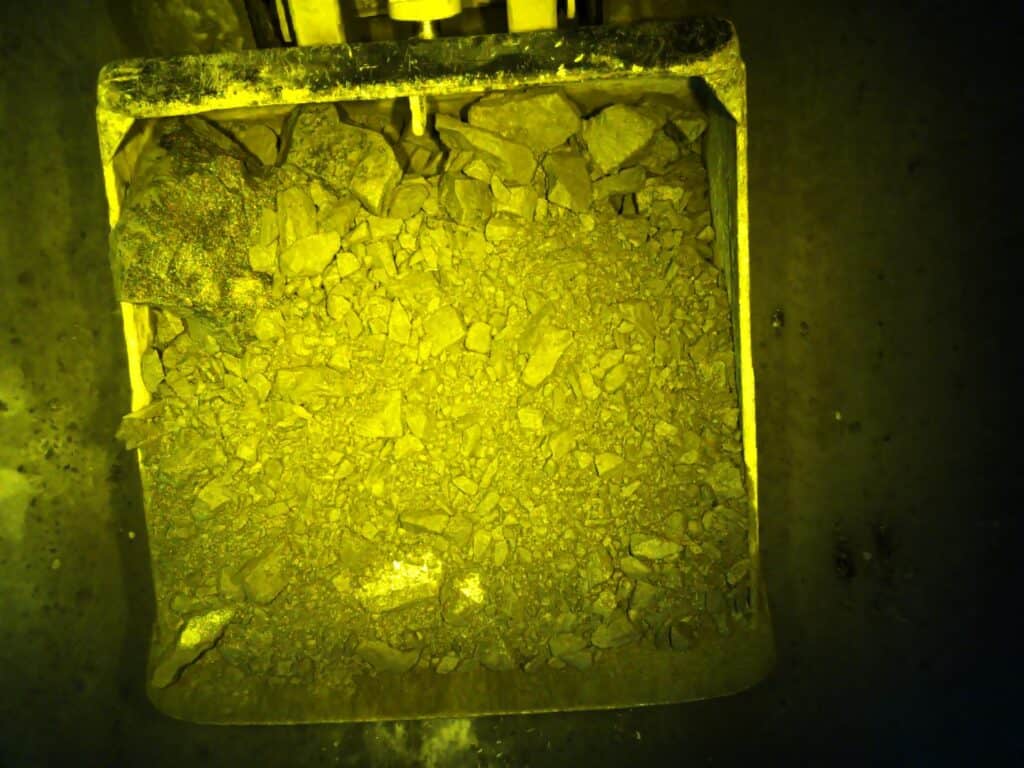
Fragmentation control doesn’t stop at the muck pile. During haulage, WipWare’s Reflex extends analysis to every truckload of material. Equipped with high-resolution cameras and an onboard computer, Reflex captures real-time images of material in transit, either while loaded on the truck or when being dumped at the crusher hopper or stockpile.
This technology enables continuous monitoring of material quality from each blast bench, providing operators with valuable data on fragmentation size, shape, uniformity and ore type variation. The Reflex system thus acts as vehicle load assessment platform, ensuring that no load goes unanalyzed.
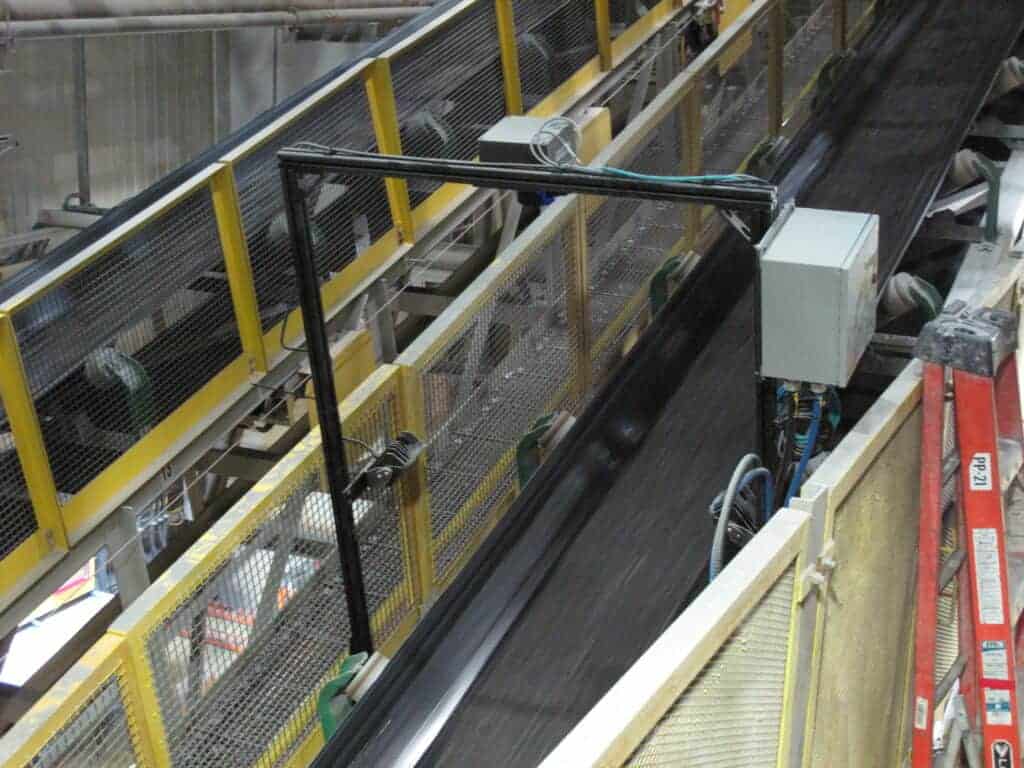
Conveyor Belt Monitoring and Process Optimization with Solo 6
At the mineral processing stage, WipWare Solo revolutionizes comminution monitoring. Installed over conveyor belts, Solo continuously analyzes the size distribution of material feeding the crusher or exiting as product. This intelligent system provides live feedback to operators, empowering them to make real-time decisions for process optimization.
Solo integrates seamlessly with existing process control systems such as Modbus TCP and OPC UA, allowing direct communication with plant control networks. This enables automatic crusher gap adjustment, SAG mill feed control, and load balancing, ensuring that the plant operates within optimal limits.
By maintaining consistent feed size and adjusting operational parameters accordingly, Solo helps minimize bearing pressure, reduce liner wear, improve throughput, and enhance overall energy efficiency throughout the comminution circuit.
WipWare technology provides a fully integrated suite of solutions that cover every stage of the comminution chain, from pre-blast geological assessment (WipJoint), through post-blast fragmentation evaluation (WipFrag), haulage assessment (Reflex), and processing control (Solo). By quantifying and connecting each step, WipWare enables mines to measure, monitor, and optimize energy use across the entire operation. The result is smarter blasting, improved crusher efficiency, and a more sustainable approach to mineral processing, achieving the ultimate goal of energy-efficient comminution.
Mine-to-Crusher Application of WipWare Solutions: Case Study at dstgroup Quarry
This study presents the third phase of a three-part research series focused on optimizing the interface between blasting and primary crushing operations at dstgroup aggregate quarry in Portugal, using WipWare solutions. The central goal is to improve fragmentation outcomes to better align particle size distribution (PSD) with crusher requirements, thereby reducing energy consumption and enhancing operational efficiency.
Building on the baseline methodology developed in Part 1, which incorporated 3D bench modeling and borehole surveys to assess blast compatibility with crusher specifications, the study identified discrepancies between predicted and actual fragmentation results. Part 2 applied targeted adjustments, such as reducing subdrill depth and altering stemming material, achieving measurable improvements in D80, maximum fragment size, and overall blast efficiency. However, boulder formation persisted in certain blast rows, prompting further optimization.
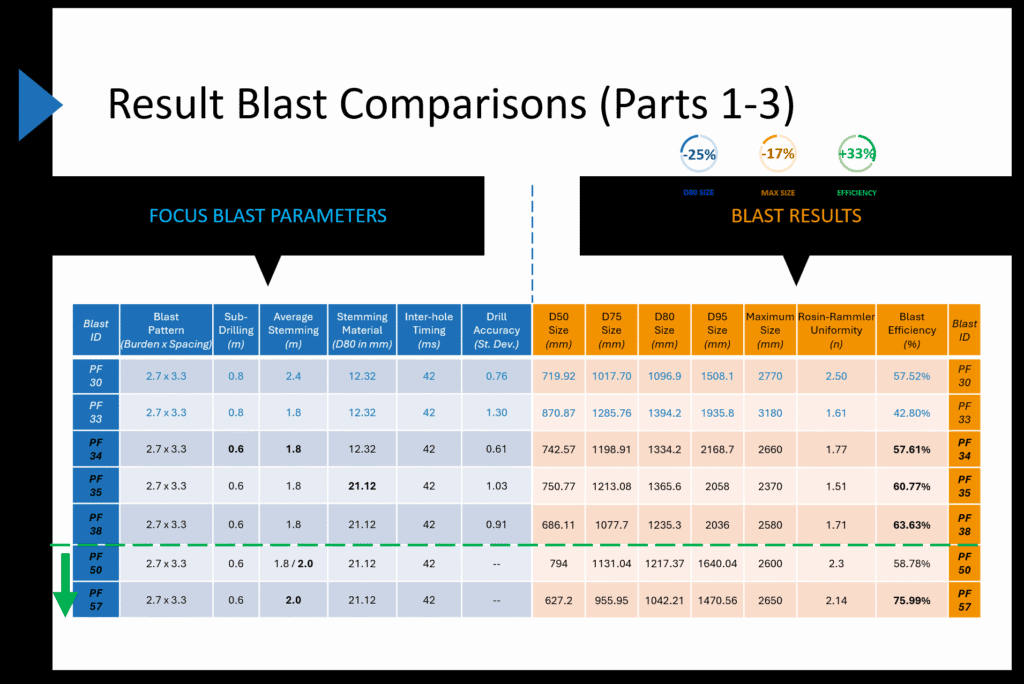
In this phase, the team implemented remaining recommendations, including refined drill and blast patterns, increased stemming size (from D80 12 mm to 21 mm) and length (from 1.8 m to 2 m), improved drilling accuracy, and adjusted inter-hole timing. High-resolution drone imagery and point-by-point blast surveys were integrated into O-PitSurface simulations to evaluate blast performance. WipFrag software was utilized for detailed particle size analysis, enabling comparison of fragmentation outcomes before and after design modifications.
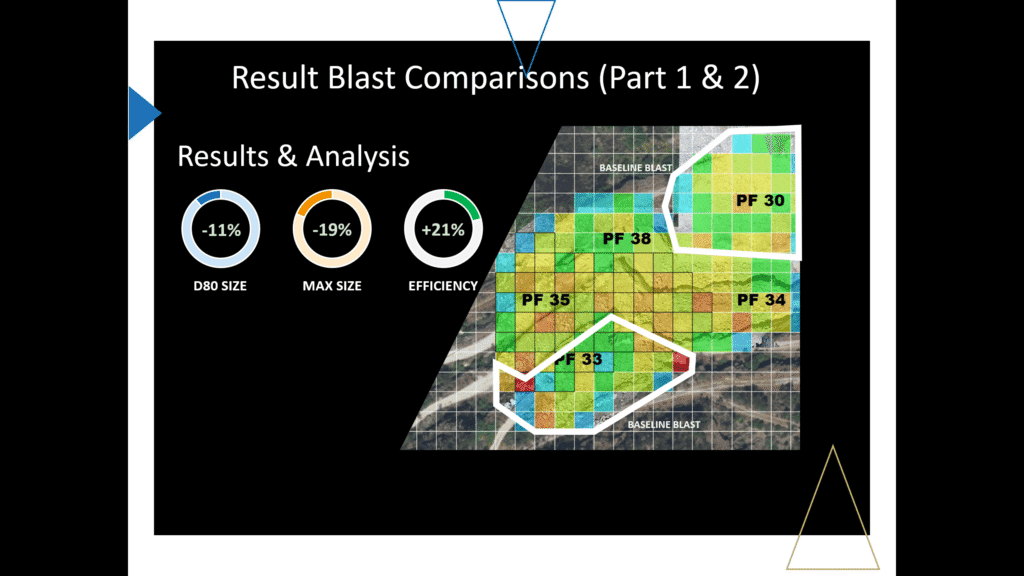
Results demonstrated significant gains: D50 decreased by 19%, D80 and D95 by 20% and 23%, respectively, and maximum particle size reduced by 3%, indicating better control over oversized material. Fragmentation efficiency improved by over 21%, and the uniformity index increased by 16%, reflecting more consistent and predictable PSD. Adjustments to stemming material and length enhanced energy confinement, minimizing premature blowout and promoting even energy distribution throughout the blast column.
Run-of-mine monitoring with the Reflex system above the primary crusher provided real-time PSD analysis, confirming continuous improvement in fragmentation and crusher feed consistency. Over a six-month period, key size distribution metrics consistently trended downward, validating the effectiveness of iterative blast parameter adjustments and demonstrating the value of data-driven, integrated mine-to-crusher strategies.
In conclusion, the study illustrates how WipWare solutions, including WipFrag, Reflex, and O-PitSurface, enable quarry operations to optimize fragmentation, reduce oversize and fines, improve crusher compatibility, and enhance overall operational efficiency. The mine-to-crusher framework serves as a replicable model for energy-efficient, predictable, and high-performance blast-to-crusher integration.
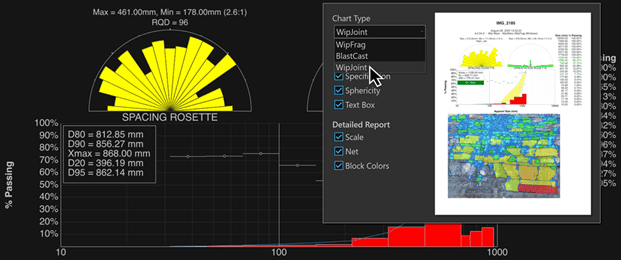
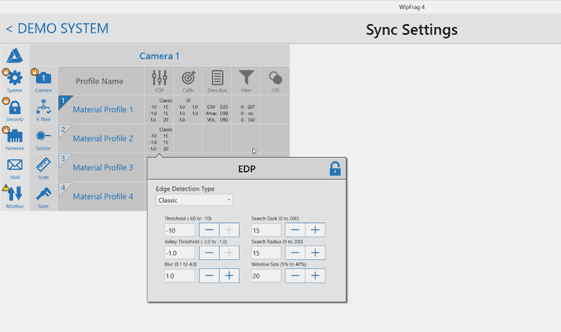
What Edge Detection Parameters (EDP) should I use?
When using WipFrag to analyze muck piles, you can use the following guidelines:
Fines = Sliders to the right
Medium = Sliders in the middle
Large = Sliders to the left
Generally, you want to have accurate nets on the small- to medium-sized particles. Once you find a suitable net for this size of material you can manually edit the larger material. Using this method will help provide more accurate results.
It’s also recommended that you try to keep a similar EDP for images of the same muck pile, or when trying to compare different muck piles.
If finer adjustments are required, you can activate the ‘Show Advanced Controls’ checkbox to access numeric inputs featuring a wider range of finer adjustments than the basic sliders provide.
WipWare Automated Photoanalysis Systems and EDP
In Delta, an advanced version of WipFrag software that runs on WipWare automated photoanalysis systems, we use a process called Best Fit EDP. For online systems, this process is usually done on-site at the time of installation. It is implemented by taking an image of typical material once all hardware and software settings have been completed. We manually trace as many particles as possible and then run the Best Fit EDP feature. The software will then try and match the manual trace of the particles using the available EDP settings. Best Fit EDP outputs a set of numeric values which will be entered into the EDP advanced controls. This method is very accurate and provides our online systems with well suited Edge Detection Parameters. It is rare that an online system EDP will need to be changed, but if so can be done remotely from our headquarters.
Best Fit EDP was recently added to WipFrag software. Because of the time involved in editing an image to produce a good Best Fit EDP, this feature is most practical to reduce the amount of manual editing required if you are going to be analyzing many images (20, 30 or more) of the same material under the same conditions. For most users, where smaller batches tend to be analyzed at once, using the sliders to adjust the EDP is faster.
Within WipFrag, there is also a feature called Auto EDP which attempts to determine the edge detection parameters automatically. This feature works well if the particle size range is narrow.
Are you new to photoanalysis technology? Perhaps you have an installation, and would like to investigate other locations to improve efficiencies? Read on past the jump for some of WipWare’s most popular locations.
Where would be an ideal location to install your technologies?
There are 5 main locations where photoanalysis technologies are installed, all of which have a similar theme of analyzing material after it has been reduced in size. I’ve listed a few (of the many) popular locations, from the mine to the mill:
Blast Fragmentation
Unlike conveyor belt technologies, blast fragmentation systems are providing particle sizing data that would otherwise be unquantifiable. As an example: When mine team is asked how they were determining blast performance, they responded with: “Well, we try to compare it just by looking at it”. By putting quantifiable values beside the material being dumped into the primary crusher, we eliminate any bias and baseline the blasting performance.
Now, think for a second how much cheaper it would be, if you could do most of your material breaking in the blasting phase: Reduced crusher needs, less maintenance on equipment, and significantly reduced energy costs to name a few of the benefits of optimizing blasting procedures.
Post-primary/Post-secondary crusher
Either Jaw, Gyratory, or Cone, whatever type of crusher you use to break down your material, if it’s primary, secondary or tertiary crushing, you should be looking into evaluating the performance of those crushers, in order to a) maximize liner life, b) make crusher gap adjustments, c) change worn out liners before oversize contaminates your stockpile, d) improve overall crusher throughput.
See, most crusher maintenance schedules are based on a fixed timeline, when many variables can affect the lifetime of the liners. Think ore hardness, size, etc.
In fact, going back to a previous blog post, you can actually begin automating that part of your process for maximum efficiency.
Screen Breakages
If you need immediate screen breakage or wearing indicators, photoanalysis technologies can detect oversize material post screening extremely well. Aggregate producers, for example, see significant value in identifying out-of-spec material immediately after a screen failure has been identified.
SAG Optimization
This is probably the location with the biggest potential return on investment, and is the most common first installation: Imagine controlling your stockpile blend based on continuous particle sizing information. Being able to optimize SAG feed can save an operation significant cost in a variety of areas.
Know when to feed from the coarser sides of the stockpile, or from the middle.
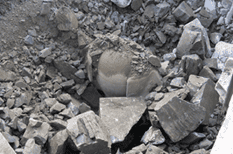
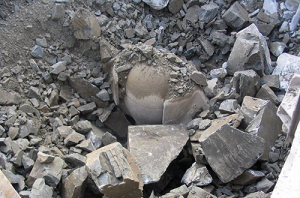
What happens to your blast fragmentation when you have excessive inter-row distance (burden)?
Introduction – Excessive Burden
According to Prasad et al. (2017), rock fragmentation size is a very important parameter for an economical point of view in any surface mining. Excessive inter-row distance, often referred to as an increased burden in blasting operations, can occur due to poor drilling operation (human factor, machine factor).
Applying Chapman–Jouguet (CJ) Condition:
The CJ condition holds approximately in detonation waves in high explosives. It states that the detonation propagates at a velocity at which the reacting gases just reach sonic velocity as the reaction ceases. In such case, excessive burden affects explosive energy distribution by diminishing the efficiency of the explosive shock wave travel, which impacts the creation of micro-cracks.
CJ Plane Theory
According to the CJ plane theory, an optimal burden ensures effective shock wave propagation and micro-crack formation, crucial for breaking rock.
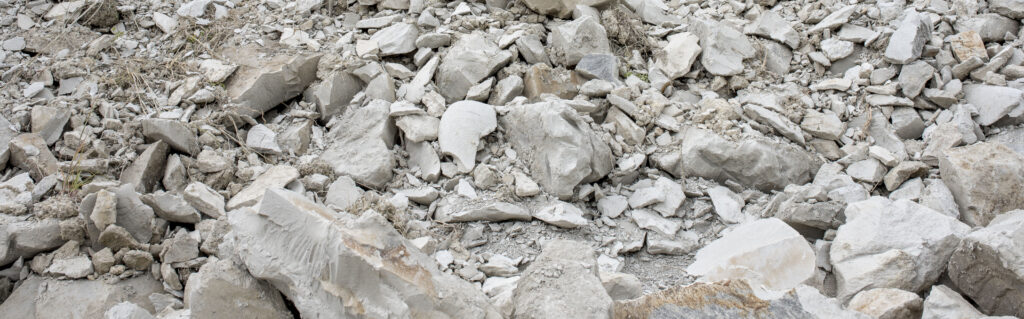
With excessive burden, energy dissipates before adequately fracturing the rock, leading to poor fragmentation. This inefficient energy transfer disrupts the detonation process, reducing the effectiveness of the blast and resulting in larger, unbroken rock pieces.
Burden Distance Affects Rock Fragmentation
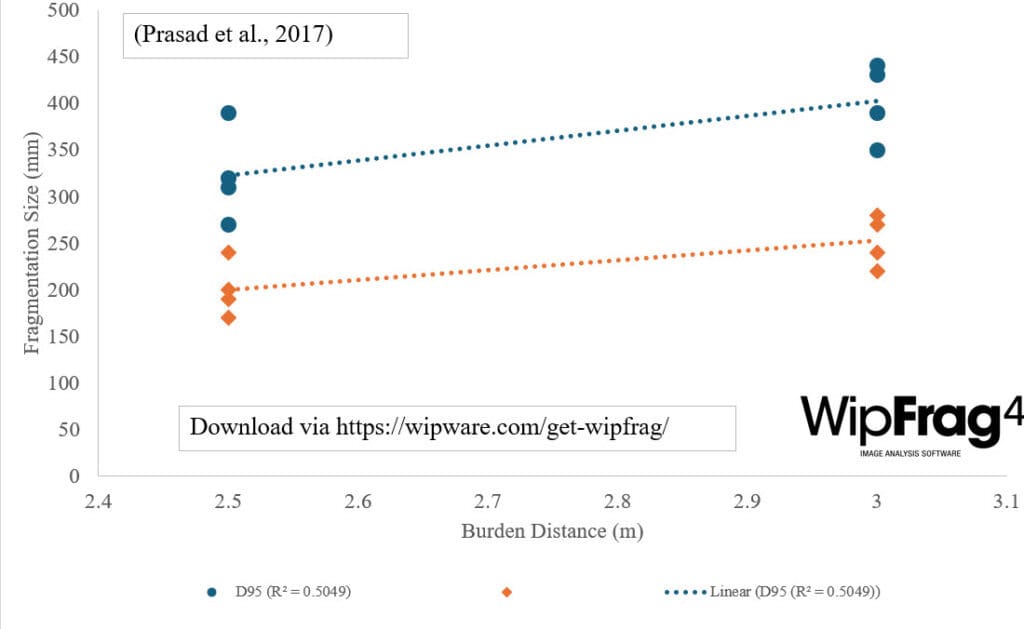
This article makes use of data from Prasad et al. (2017) to explain further the effect of burden increments from 2.5 to 3m. As shown by the regression line, the analysis revealed that the blast fragmentation size (D50 and D95) increases with more than 50% positive correlation.
This shows that, the larger the burden distance, the bigger the rock fragment generated from the blast. Having excessive burden with the same powder factor will definitely affect the fragmentation size and shape. To account for how your current burden is affecting your fragmentation, you should first assess your borehole condition before charging.
Furthermore, assess your blast results using image analysis software. WipFrag software is the most highly recommended blast assessment software, with a long history in addition to the latest technological innovation. The software offers significant advantages in assessing mine burden effects on fragmentation. Using the app on mobile phones allows for convenient, on-site analysis.
Deep Learning Capabilities
Deep learning capabilities save analysis time by quickly processing images. The boulder detection tool identifies oversized fragments, while the specification envelope helps correlate blast results with downstream primary crusher performance, ensuring optimal fragment sizes for efficient crushing and improved overall operational efficiency.
Prasad, S., Choudhary, B. S., & Mishra, A. K. (2017, August). Effect of stemming to burden ratio and powder factor on blast induced rock fragmentation–a case study. In IOP conference series: materials science and engineering (Vol. 225, No. 1, p. 012191). IOP Publishing.
Excessive burden in blasting refers to having too much rock mass in front of the blast holes. This is relative to the designed blast parameters. The burden is the distance between a blast hole and the free face.
If this distance is too large, it can significantly impact the efficiency and effectiveness of the blasting operation. Here are some effects and consequences of excessive burden:
1. Incomplete Fragmentation:
When the blast design has too much burden distance between rows, the explosive energy may not be sufficient to break the rock effectively, leading to large, unbroken boulders or slabs.
2. Higher Vibration and Noise:
Relating ground vibration to this phenomenon, excessive burden can cause more energy to be transferred to the ground as vibrations, potentially causing damage to nearby structures and creating safety hazards (Blair & Armstrong, 2001).
On the other hand, inadequate burden can result in higher levels of air overpressure and noise, affecting the environment and nearby communities.
It’s worth noting that when there is excessive burden in blast design, the energy from the explosives is not used efficiently, leading to wasted explosive material and higher operational costs.
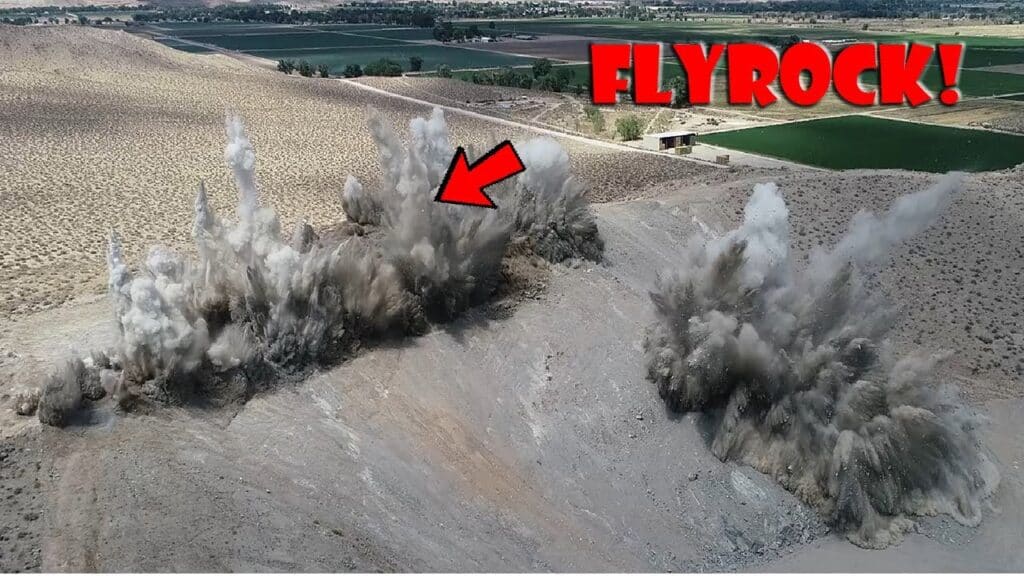
3. Flyrock Hazards:
Excessive burden can cause unpredictable flyrock, posing significant safety risks to workers and equipment.
4. Inefficient Loading and Hauling:
The resulting muckpile from an overburdened blast may have uneven fragmentation. This makes it harder to load and transport the material efficiently.
5. Incomplete Detonation and Misfires:
Excessive burden can cause incomplete detonation of explosives. This leads to misfires and the need for re-blasting, which adds to safety risks and costs.
Conclusion
In their paper for the 2nd World Conference on Explosives and Blasting Technique in 2003, Onederra and Esen stated that there is usually a discrete element of time that has elapsed from the time of explosive detonation to mass burden displacement. This time is designated as the minimum response time (Tmin) and is dependent on the burden mass, explosive and dynamic material response to the explosive stimulus. Generally, but not always, Tmin can be decreased by employing small burdens, using higher energetic explosives or a combination of both.
References
Blair, D. P., & Armstrong, L. W. (2001). The influence of burden on blast vibration. Fragblast, 5(1-2), 108-129.
Onederra, I., & Esen, S. (2003). Selection of inter-hole and inter-row timing for surface blasting—an approach based on burden relief analysis. In Proceedings of the 2nd world conference on explosives and blasting technique, Prague. Taylor & Francis (pp. 269-275).
Download WipFrag at https://wipware.com/get-wipfrag/. Assess your blasting results, spot regions with poor fragmentation and trace back to your drill and blast design.
We use cookies on our website to give you the most relevant experience by remembering your preferences and repeat visits. By clicking “Accept”, you consent to the use of ALL the cookies.
This website uses cookies to improve your experience while you navigate through the website. Out of these, the cookies that are categorized as necessary are stored on your browser as they are essential for the working of basic functionalities of the website. We also use third-party cookies that help us analyze and understand how you use this website. These cookies will be stored in your browser only with your consent. You also have the option to opt-out of these cookies. But opting out of some of these cookies may affect your browsing experience.
Necessary cookies are absolutely essential for the website to function properly. These cookies ensure basic functionalities and security features of the website, anonymously.
Cookie
Duration
Description
cookielawinfo-checbox-analytics
11 months
This cookie is set by GDPR Cookie Consent plugin. The cookie is used to store the user consent for the cookies in the category "Analytics".
cookielawinfo-checbox-functional
11 months
The cookie is set by GDPR cookie consent to record the user consent for the cookies in the category "Functional".
cookielawinfo-checbox-others
11 months
This cookie is set by GDPR Cookie Consent plugin. The cookie is used to store the user consent for the cookies in the category "Other.
cookielawinfo-checkbox-necessary
11 months
This cookie is set by GDPR Cookie Consent plugin. The cookies is used to store the user consent for the cookies in the category "Necessary".
cookielawinfo-checkbox-performance
11 months
This cookie is set by GDPR Cookie Consent plugin. The cookie is used to store the user consent for the cookies in the category "Performance".
viewed_cookie_policy
11 months
The cookie is set by the GDPR Cookie Consent plugin and is used to store whether or not user has consented to the use of cookies. It does not store any personal data.
Functional cookies help to perform certain functionalities like sharing the content of the website on social media platforms, collect feedbacks, and other third-party features.
Performance cookies are used to understand and analyze the key performance indexes of the website which helps in delivering a better user experience for the visitors.
Analytical cookies are used to understand how visitors interact with the website. These cookies help provide information on metrics the number of visitors, bounce rate, traffic source, etc.
Advertisement cookies are used to provide visitors with relevant ads and marketing campaigns. These cookies track visitors across websites and collect information to provide customized ads.