
We’ve put together some photoanalysis systems FAQs based on questions from our customers.
WipWare Image Analysis Systems produce real-time 24/7 results that allow personnel to identify, evaluate, and optimize troublesome areas of their process while maintaining production.
Our systems are installed in many different applications around the world. These applications vary from analyzing wood chips to detecting oversize material or contamination in diamond mines. The applications are endless.
From Mine to Mill
The term Mine to Mill highlights the importance of fragmentation data on both the blasting and processing end of operations. This term applies well to WipWare line of products from the muckpile after a blast to analyzing material on the conveyor.
Mine-to-mill technology takes the entire system into account, from the blasting process to the comminution circuit. This optimization provides a complete fragmentation and size reduction solution to maximize benefit.
WipFrag Image Analysis Software
WipWare’s WipFrag 4 Image Analysis Software effectively analyzes data from a recent blast and produces results of the blast material on-site in minutes.
Reflex Vehicle Analysis System
From there, as the trucks haul the material to the primary crusher, you can detect oversize material or contamination and divert the material accordingly.
Once at the primary crusher, our Reflex systems can detect oversize material, contamination or give full particle size distribution analysis as the material is dumped.
Solo Conveyor Analysis System
After the material has gone through this process our systems can continue to analyze the material on the conveyor belt. 
At this stage, you can determine what is the most important information you want to retrieve: detect oversize, divert material, identify contaminated material or receive full Particle Size Distribution data 24/7 in real-time.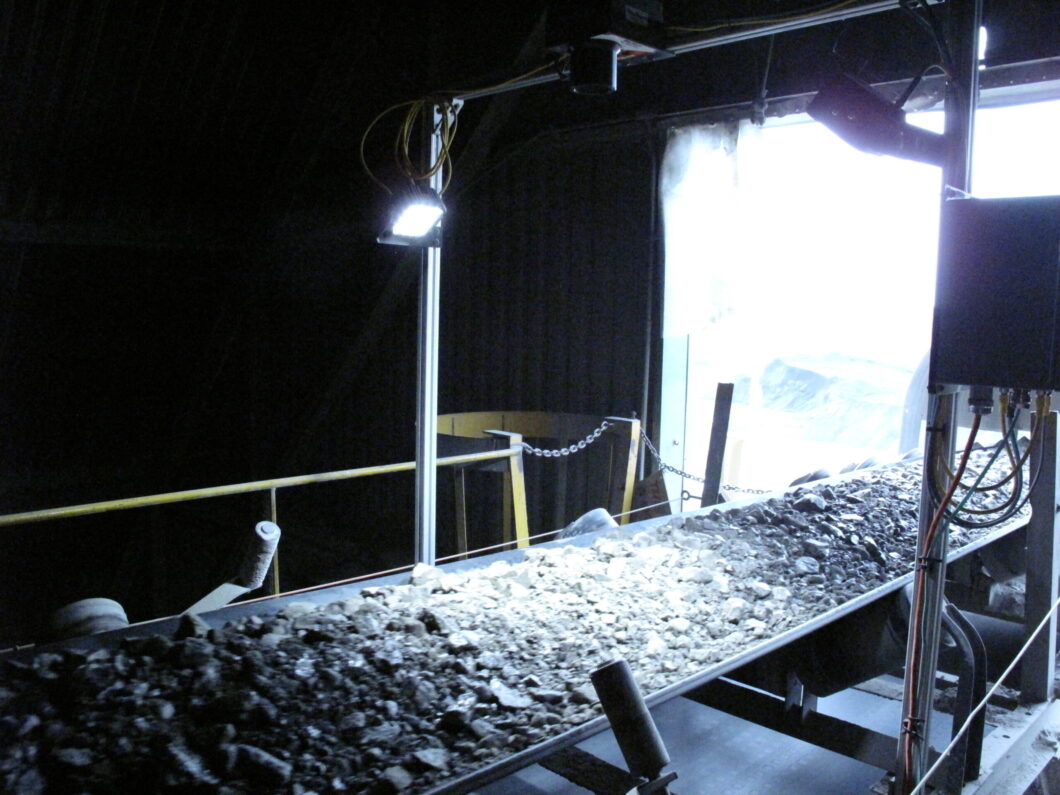

Now, here’s the cool part: our WipFrag software is also the HMI (Human to Machine Interface) for our systems. Not only can you use our software separately to analyze your blast material, but the same software is also used to analyze your material all along its journey from Mine to Mill.
Many potential customers ask this very question about the benefits of WipWare products. Well, here’s the answer.
WipWare offers industry-leading photoanalysis technology for accurate, real-time fragmentation assessment, optimizing blasting, crushing, and grinding operations. With features like deep learning, auto-scaling, GIS compatibility, and orthomosaic analysis, WipWare ensures precise measurement and continuous improvement. The software’s specification envelope, histogram reporting, and boulder counting enhance decision-making, reducing downtime and costs. Additionally, WipWare provides flexible pricing, cross-shipping warranties, and expert support, making it the top choice for efficient mining and aggregate operations.
Furthermore, our online Systems provide data to the customer 24/7 to identify troublesome areas of your process from Mine2mill.
In conclusion, our Solo Basic or Complete, Reflex Basic or Complete and WipFrag software can drastically lower energy, and maintenance costs, as-well as cut equipment downtime and aid in quality control.
WipWare uses precise belt-depth detection lasers to detect both
A) Empty belts, as with previous Solo models
B) The depth of material on the conveyor belt
When you tie the material depth information with the conveyor belt speed and your belt weightometer reading, you are able to extract the specific gravity of the material passing. Having the specific gravity information will allow you to determine whether the material passing is waste or ore-bearing material. 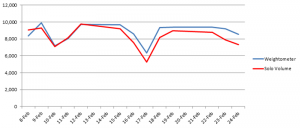
In preliminary tests at a limestone operation, WipWare was able to reach 94% correlation between the volumetric calculations and the belt weightometer readings.
An operation could use this information to divert waste material from entering the crushing process, saving significant amounts of money in maintenance and energy costs.
Volumetrics users have the added benefit of receiving accurate particle sizing results as well as another new feature allowing you to detect contamination.
With size, shape, volume and contamination detection data being streamed seamlessly in real-time, WipWare’s automated technologies are providing three times as much accurate data metrics than competitors.
At WipWare, we often coin ourselves as a mining and aggregate technology provider, as these two industries make up the most of our business. The beauty of photoanalysis technologies, is that with a suitable image, our products can analyze anything from micron material to planets. We all know that automated particle sizing is a crucial part of the mining and aggregate industry, but as you will see, material size is not only important for rocks. Here are some of the cool applications we have had the pleasure of working with:

Mars Curiosity Rover: There may not be any mining on Mars (that we know of), but the Curiosity rover is taking pictures that are being analyzed for oversized obstacle detection. What a great way to identify and steer clear of obstacles and keep Curiosity roaming.
Scrambled eggs. That’s right, I said scrambled eggs. A food supplier from the US contacted us looking to optimize the fluffiness and fragmentation of the scrambled eggs they use. I’ll never look at scrambled eggs the same way ever again.
Processed kimberlite: Getting out of our chef’s apron and putting our hard hats back on, we have been working very closely with multiple diamond companies around the world to accurately analyze the process kimberlite material on their conveyor belts. What’s so incredible about this application? Well, it’s pretty normal, except for the fact that the material ranges from as low as 1.2mm (0.0472440″ for our Imperial friends). Once again, if a suitable image can be captured, WipWare can analyze it.
…And of course, we work with hundreds of applications that deal with broken screen detections, contamination, quality control procedures, pre- and post- crusher optimization and SAG mill throughput applications.
Both Delta (Solo 6 and Reflex 6) and WipFrag produce a percentage passing curve visible after each virtual sieve analysis. It also saves the data to a CSV (comma-separated values) file. Each sieve analysis produces a new line in the CSV file that represents the results from the sieve.
This CSV file contains:
– Timestamp (Year/Month/Day/Hour/Minute/Second)
– D-values (XX% passed the specified size – Ex. 90% of the material passes 13.87 inches[352.30mm])
– User specified size classes (% passing or retained at the specified size)
– Block (amount of particle detected)
– Min, Max, Mean, St. Dev, Mode
– Sphericity (The shape of the material – 0=Linear Objects 1=Perfectly Round)
– Coverage (How much of the image is used)
– Calibration Values (b, Xmax, X50, Xc and n)
– EDP values (Edge Detection Values)
– Calibration factors
– System info (CPU temp, Board temp, Voltage checks)
– System uptime
– Camera setting at the time of the image.
– Modbus and OPC poll rate
– Vehicle Identification Information (Reflex Only)
Delta (Solo 6 and Reflex 6) can e-mail these CSV files automatically as well as an average of the entire day on one passing curve. It also has a trending graph in the lower section of the software interface which trends the data for the current day.
In addition, Delta has the ability to output the analysis information using a Modbus or OPC connection to pass information on to your historian, PLC or HMI.
The only regular maintenance required for our systems is to ensure the lens and lights are clean with as little dust/dirt as possible.
The frequency that the system will need to be cleaned will depend on the environment it operates in:
ENVIRONMENT/ FREQUENCY
Very dusty 1-3 weeks
Moderate dust 2-6 weeks
Little or no dust 4-8 weeks
Method 1: Water hose
The first method is the most common. Using a water hose, simply spray down the system ensuring the lens is clean and free of any noticeable dust or dirt. If possible, use a squeegee to remove any droplets that may remain on the lens. Doing this helps prevent dust from collecting in the droplets that remain which could leave deposits on the lens that interfere with image capture. Since our systems are completely waterproof this method is usually the easiest and most effective way to clean the lens. It can also be done without having to shut down the conveyor belt.
Method 2: Clean damp cloth/paper towel
Another option is to use a clean damp cloth or paper towel with water or Windex. Using a clean microfiber cloth would be ideal, but those may be hard to find at mine sites. Try not to press to hard when wiping the lens, the accumulated dust could leave scratches in the lens if too much pressure is applied. Note: In sub Zero Temperatures refrain from using water or Windex as it will freeze to the lens and cause inadequate image quality. We recommend using standard windshield washer that is rated for the correct sub-zero temperature.
Method 3: Compressed air
It’s also acceptable to use compressed air from a can or hose to dust off our systems. This method works well but will kick up a lot more dust than the liquid methods. We recommend using a dust mask when using compressed air to clean off out systems.
Simple answer is yes.
The computer can store up to 1000MB worth of images without any issues. Once beyond this point the hard drive could start having problems accessing the image folder causing the computer to run slower than normal, so the oldest images are overwritten automatically.
Note: All the particle size data is kept in a CSV file which is a much smaller size and allows you to store data over a longer timeline.
Most of our systems use a 1.2MP camera and the images average 180KB each, so 1000MB of storage can accommodate approximately 5600 images.
Running 24 hours per day the system can roughly save the following number of images:
If you are taking 1 image every 20 seconds you would have 4,320 images per day. ~31.2 hours
If you are taking 2 images every 20 seconds you would have 8,640 images per day. ~15.5 hours
If you are taking 3 images every 20 seconds you would have 12,960 images per day. ~10.3 hours
To calibrate, or not to calibrate; that is the question. And it’s an important question to ask prior to installing your online bulk material analysis system, regardless of the industry you’re in. Let’s help you figure out why calibration may or may not be your best bet, and whether you will see value in calibrating your system.
One of the deficiencies with image-based rock fragmentation analysis technology is the inability to analyze underlying material running on a conveyor belt. So, in normal circumstances, without calibration, fine material is typically under-represented when using image analysis. The same thing can be said for blast fragmentation analysis, but I will touch on this a little later in the article.
If photo analysis technologies represent material on the top layer, and under-represent the underlying material, an operation can compensate for this deficiency by calibrating. (For the how-to guide on calibration, check out this link).
The way I see it, without sounding too much like a broken record, calibrated photo analysis technologies take the best of both worlds: Quantity and quality.
Take the following scenario as an example: Company ABC wants to adjust the SAG feed based on particle size analysis. By doing so, they need to know when to draw fine material from the stockpile and when to draw coarser material. Calibration allows for the proper “mix” of bulk material in order to optimize the process.
The Swebrec and Rosin-Rammler functions are great for adjusting the distribution curve to accurately compensate for fine material… But what if you are looking strictly at the coarse sizes, say, for oversize detection?
If this is the case, you may want to reconsider the calibration process.
Allow me to explain:
A calibrated system is making certain assumptions about material underneath the top layer and may even bias your coarse material fractions when trying to adjust the distribution curve. So, if you are planning on having a conveyor belt shut down if it detects material over x size, you may want to reconsider taking the chance of biasing your results. Instead, an uncalibrated system is going to get you very useful data that will allow you to stop/start/act on out-of-spec readings and optimize your process.
What are other reasons why clients don’t calibrate?
When material is too large, it is much more difficult to manually sample material, and this could be cost-prohibitive. This issue arises most often on the blasting end of the application, where blast optimization relies heavily on detecting relative changes in material size.
For post-crusher analysis, some clients detect liner wearing by relative increases in the size of material, therefore making calibration unnecessary.
In summary, calibration certainly has its uses inside the mining and aggregate industries, and more specifically, when finer material sizes are a necessary part of the quandary; however, uncalibrated systems are still very useful in optimizing your process and for tracking relative change.
WipWare Inc. provides a one-year limited warranty on all products, including components and software. To offer customers peace of mind, WipWare also offers an annual service contract, which includes exclusive technician service rates, monthly check-ins, extended system warranties, and more.
With the purchase of any WipWare photoanalysis product, the warranty covers cross-shipping for any defective product under the WipWare Limited Warranty, ensuring minimal downtime for customers.
For full WipWare Limited Warranty details see here.
WipWare goes above and beyond to ensure that not only customers, but any individual or company who may show interest in a WipWare product has the utmost training and confidence when it comes to utilizing our extensive line of photoanalysis systems. WipWare offers free training to individuals, companies, colleges, and universities interested in learning about our products. We recently conducted on-campus workshops for mining students at Queen’s University (Kingston), Laurentian University (Sudbury), and ÉTS University (Montreal). In addition to in-person sessions, we provide virtual training and have a library of training videos available for easy access.
For more information about WipWare training please contact support@wipware.com
For more information about our systems, please visit our YouTube channel.