Articles tagged "wipfrag"

Installations

Literature Review: Application of WipWare Technology

Blast on a bench face

WipWare’s fragmentation analysis technologies have been widely applied across various mining operations to solve critical challenges. These were associated with material flow, fragmentation consistency, energy use, and overall process efficiency. I came across Tom Palangio‘s works on numerous case studies highlighting the effectiveness of WipWare‘s tools. These tools optimized blasting practices and downstream processing. This review presents a summary of several influential studies and industrial applications of WipWare technology.

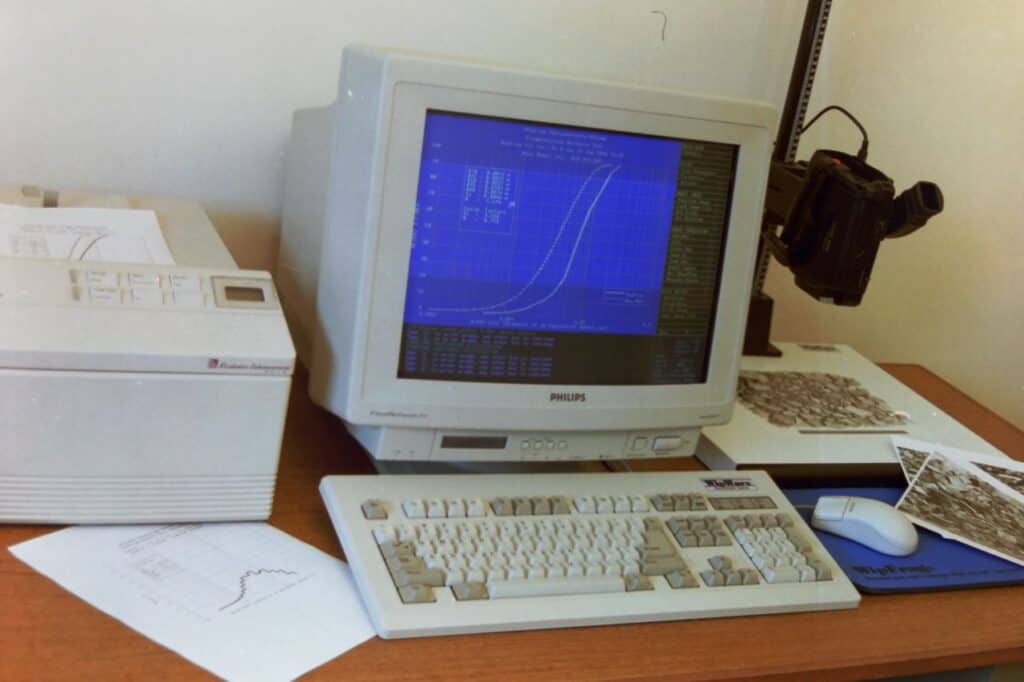
Photographic Fragmentation Analysis

Selbaie Mine, Joutel, Quebec, Canada

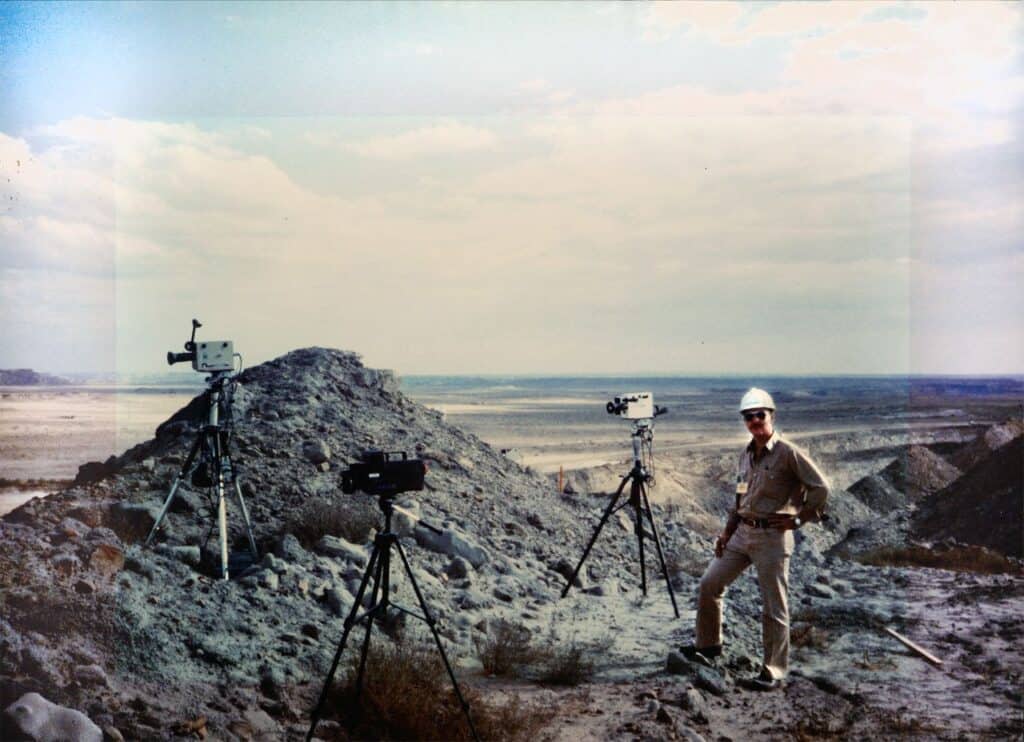
In the mid-1990s, Selbaie Mine utilized photographic fragmentation analysis using WipFrag to assess explosive performance and optimize blasting patterns. The integration of WipWare technology enabled the mine to monitor and control several key performance indicators. Some of these indicators included energy consumption for crushing, loading rates, haul truck payloads, secondary blasting costs, and maintenance expenditures. Fragmentation data revealed a more comprehensive understanding of the effects of blast results on overall mining cost structures. This information allowed the mine to better manage ore processing operations. They could quantify the true cost of mineral handling based on fragment size.

Significant Pattern Optimization

INCO Coleman Mine, Sudbury, Ontario, Canada

INCO’s Coleman Mine used WipFrag during a detailed study in 1994, resulting in significant pattern improvement. The original tight blast pattern (5ft x 10ft) yielded a characteristic size (Xc) of 0.617 m, with substantial oversize material requiring re-blasting. Progressive expansion of the blast pattern to 6ft x 10ft and eventually 7ft x 10ft not only improved fragmentation (Xc = 0.318 m) but also reduced oversize entirely. WipFrag data was instrumental in determining optimal fragmentation, with INCO realizing up to 40% blast pattern expansion and 80% cost savings. Additionally, the technology allowed for reductions in fines generation, further streamlining ore handling and improving crusher feed quality.

Correlate Ore Fragmentation and Hardness with Mill Performance

Highland Valley Copper, Logan Lake, British Columbia, Canada

At Highland Valley Copper (HVC), the team used WipWare tools to correlate ore fragmentation and hardness with mill performance. WipWare’s WipFrag software, Reflex vehicle analysis system and Solo conveyor analysis system played a central role in tracking ore size distributions from the pit through to the mill feed. This enabled real-time optimization of crusher and mill settings. The mine’s dispatch system integrated fragmentation data to guide stockpile management and minimize feed segregation. WipFrag analysis revealed that feed consistency across the grinding lines could be improved by adjusting feeder ratios. This capability to quantify fragmentation effects allowed HVC to perform cost benefit analyses and optimize the balance between blast quality and mill throughput.

Detonator Timing Accuracy and Improved Fragmentation using WipFrag

Bartley and Trousselle – Ogdensburg, New York, USA

At Benchmark Materials Quarry, Bartley and Trousselle demonstrated the link between detonator timing accuracy and improved fragmentation using WipFrag. Digital programmable detonators yielded superior blast uniformity and reduced vibration levels. WipWare’s image analysis facilitated the evaluation of blast performance improvements by providing accurate fragmentation size distribution data.

The Effects of Improved Fragmentation on Mechanical Performance and Power Usage in the Crushing Circuit

Lafarge Canada Inc. – Exshaw, Alberta, Canada

Lafarge’s Exshaw operations applied WipFrag to examine the effects of improved fragmentation on mechanical performance and power usage in the crushing circuit. A redesigned blast using 102 mm holes led to more uniform fragmentation. This resulted in a 16% increase in crusher throughput and a 30% reduction in power consumption. WipWare data also informed decisions related to equipment selection (e.g., drill bits) and wall control, leading to improved safety and reduced vibration impacts on neighboring communities.

Cost-Effective and Reliable Fragmentation Assessment Tool

Barkley and Carter – Evaluation of Optical Sizing Methods

Barkley and Carter evaluated WipFrag as both a cost-effective and reliable fragmentation assessment tool. Their work highlighted that previous blast optimization efforts were constrained by the lack of efficient sizing techniques. In contrast, WipFrag enables meaningful decision-making in blast modeling, mining method selection, and economic planning. The study underscored the significance of image-based sampling frequency, particularly in varied muck pile conditions, to derive actionable insights on crusher performance and feed consistency.

Assess Fragmentation and Stemming Uniformity

Chiappetta, Treleaven, and Smith – Panama Canal Expansion

During the expansion of the Panama Canal, WipFrag was employed to assess fragmentation and stemming uniformity in complex geological and logistical conditions. The integration of WipWare into blasting operations enabled engineers to both track blast outcomes and support adaptive design decisions in real time. In a project characterized by not only marine traffic but also saturated zones and tight deadlines, the technology provided essential support in achieving controlled fragmentation and predictable material handling.

Conclusion

These reviewed case studies emphasize WipWare’s critical role in improving the efficiency and economics of mining operations. Through accurate and real time fragmentation analysis, WipWare technologies facilitate optimization across the mine to mill value chain. From reducing energy consumption and equipment wear, to improving blast designs and minimizing fines, WipWare’s technologies offer robust solutions to a range of material flow problems in both surface and underground mining environments. These outcomes underscore the value of fragmentation analysis in modern mining practice, unquestionably supporting data-driven decision making and continuous process improvement.

By Blessing Taiwo

WipWare

WipWare Proudly Celebrates Over 30 Years of Innovation

From a dusty DOS computer to AI-powered, real-time fragmentation analysis systems… WipWare has been at the forefront of fragmentation analysis for over 30 years of innovation, transforming how the world measures particle size.

The Beginning

From humble beginnings to global impact, we’ve come a long way. This year, we’re celebrating over 30 years of innovation in fragmentation analysis. Along the way, we’re taking a look back at the milestones. These milestones shaped us and the journey of making particle size analysis smarter, faster, and easier than ever.

Before WipWare was WipWare, our founder Tom Palangio was in the field with North Bay DuPont. He was tackling real-world challenges with innovative thinking and a practical mindset.

Below is a photo of Tom from our archives. He was working on a project that would spark the idea for our very first product in fragmentation analysis: WipFrag.

Tom Palangio with a hard hat on standing with cameras by a muckpile of rocks. Mining innovation

Solving a Global Problem

Traditionally, describing blast results in mines and quarries was limited to vague terms like “good,” “fair,” or “poor.” Manual sieving and particle counting were too costly and impractical until a team of passionate pioneers changed the game.

WipFrag was born in 1986 from groundbreaking collaboration between Franklin Geotechnical, DuPont/ETI, and the University of Waterloo. It was the world’s first digital image analysis software for measuring rock fragmentation.

Three images of rocks from a muckpile, one with a measuring tape, 4th image is the particle size distribution curve from first versoion of WipFrag

Leveraging advancements in imaging and computer processing, they created a revolutionary tool. A digital method to analyze muckpile photos or video frames to produce a detailed fragmentation size distribution curve.

The name itself carries the legacy: Waterloo Image Enhancement Process for Fragmentation or “WIEP,” later shortened to just “WipFrag.”

Since then, our journey has been marked by bold ideas, hard-earned field experience, and a commitment to excellence that has brought us to where we are today. Tom Palangio, with his explosive expertise, innovative leadership, and close collaboration with Dr. Norbert Maerz and Dr. John Franklin laid the groundwork for much of what we now take for granted in automated material analysis.

First Trials

Thanks to real-world testing in 1980s-1990s at INCO’s Copper Cliff and Coleman underground operations and Highland Valley Copper in BC, WipFrag proved its worth boosting productivity, reducing oversize, and optimizing blast patterns. Results included a 40% pattern expansion and 10% increase in mill throughput milestones that cemented WipFrag’s value in the mining industry.

We owe this innovation to the visionaries who asked, “What if we could measure fragmentation automatically?” and then made it possible. Hats off to the original developers and researchers whose dedication paved the way for what WipWare is today, 30 years strong and still leading the future of photoanalysis technology.

WipJoint and System 1

In 1990, WipJoint was introduced for measuring in-situ rock apparent block size and joint orientation.

Our journey into real-time automated analysis systems began in 1998, led by Thomas W. Palangio, the founder’s son, as he joined the company and introduced our first hardware systems. System 1 was released in 1998 with one camera for online analysis: a well-received innovation for the mining industry. The very next year, System 2 was rolled out, boasting the capacity to integrate 12 cameras for real-time analysis.

Then another year later in 2000, WipFrag 2 was developed, building on the success of the first WipFrag.

WipWware Team showing very first Solo system

In this 2007 photo, WipWare team members gather around the first Solo system — a major step forward in automated material analysis. Originally built for conveyor belts and later adapted for vehicle loads, this early unit was the seed of what would become today’s Solo 6 and Reflex 6 systems — smarter, faster, and tougher than ever.

Pictured here are two faces still leading WipWare forward today:

  • Thomas Palangio (right), now our Chief Technical Officer and Vice President of Technology
  • Kevin DeVuono (back right), now our Head Programmer

WipFrag 3 joined the arsenal in 2014 with drone and GIS capabilities, serving as HMI for our real-time analysis systems. With WipFrag now in the palm of your hand since 2016, WipWare makes it easier than ever for field personnel to assess blast fragmentation instantly, anywhere, anytime and share it across platforms for end-to-end mine-to-mill optimization.

WipFrag Goes Mobile

In 2016, WipWare brought WipFrag to mobile devices — putting fragmentation analysis directly into the hands of field personnel.

For the first time, users could capture and process muckpile images using the camera on their phone or tablet, with the option to sync and share results across devices for further analysis.
This leap in accessibility made data collection faster, easier, and more flexible — using tools people already carried with them.
Designed for the real world — and it redefined the standard.

Pit to Plant Fragmentation Analysis

In 2018 Tom Palangio, President of WipWare enjoyed an interview with The Crownsmen Partners at the CIM in Vancouver. During this interview, Tom discussed how innovation, being a disruptor in the early years and providing excellent leadership has shaped WipWare into the company it is today.

WipFrag 4 Released in 2020

In 2020, WipFrag became easier than ever for field personnel to assess blast fragmentation instantly, anywhere, anytime and share it across platforms for end-to-end mine-to-mill optimization.

WipFrag iOS user at muckpile

Fast forward to today, under the technical direction of Thomas Palangio (CTO), the company continues to redefine industry standards. His creativity, technical drive, and future-forward thinking have powered the evolution of Solo, Reflex, and WipFrag, now enhanced with Deep Learning Edge Detection for unparalleled accuracy across all environments.

From a garage in Bonfield, to a global leader in real-time fragmentation analysis – 30 years of innovation and engineering smarter solutions for the world’s toughest industries.

Since 1995, we’ve been shaping the future of mining technology with groundbreaking tools like WipFrag, Solo, and Reflex. Along the way, we’ve helped change how the industry collects and understands data. Today, we’re using edge-powered, AI-driven systems on conveyors and vehicles, even underground.

WipWare continues to provide the industry with powerful tools to help companies monitor, measure and manage their materials the smart way. Our state-of-the-art arsenal of analyzers measure particle size, shape, volume and colour data in real-time on conveyor belts and vehicles. Our comprehensive software is useful anywhere to instantly determine particle size and shape distribution without using a scale object.

Always Evolving, Always Innovating

But we’re not done — today our tools continue to evolve.

We’re enhancing the way our systems capture material composition and volume — bringing deeper insights to operations of every size. Plus, we’re refining how data becomes decision-making power. And now we’re working to bring that same clarity everywhere from underground to outer space.

Thank you to our technical team, whose work ensures every system and line of code is field-ready and rock solid.

Thank you to the innovators whose commitment, structure, and continuity make every innovation sustainable and scalable!

And most importantly, to our clients, resellers, and partners around the world — thank you for 30 incredible years. Here’s to what’s next. YOU are the reason our WipWare Team continues to push boundaries. Your trust, feedback, and collaboration fuel the team purpose. Whether you’re analyzing underground ore, surface muckpiles, aerial drone images, conveyor material, or vehicle loads, your success is our mission.

Here’s to 30 years of innovation, reliability, and excellence… And to the next decades of digital transformation in mining and material handling.

Northern Ontario Mining Showcase North Bay & District Chamber of Commerce CIM/ICM Northern Gateway Branch MineConnect

WipFrag

Understanding the Fundamentals of Blasting and Fragmentation Part 2

Overview of blast showing bore holes

Blasting and fragmentation are critical operations in mining and quarrying, significantly influencing downstream processes such as loading, hauling, and crushing. At the core of successful blasting lies a precise understanding of how energy is distributed through the rock mass. Among the key factors that can drastically affect blast outcomes is drilling deviation, a common but often underestimated issue that alters the intended blast geometry.

The Impact of Drilling Deviation

In an ideal blast design, drill holes are positioned and angled according to a specific pattern to ensure optimal burden spacing, energy distribution, and shock wave interaction. However, drilling deviation, which refers to the unintentional displacement or misalignment of blast holes can disrupt this pattern (Adebayo & Mutandwa, 2015).

Overview of blast showing bore holes

When holes deviate, the spacing and burden between them can become inconsistent. This misalignment affects shock wave propagation, leading to uneven energy transfer across the rock mass. In zones where spacing is too wide, the energy dissipates prematurely, resulting in poor rock breakage. Conversely, overly tight spacing can cause excessive energy concentration, increasing the risk of overbreak and flyrock.

These irregularities directly influence rock fracturing. A well-fractured rock mass ensures the production of uniformly sized fragments. But with drilling deviation, fragmentation becomes unpredictable. As a result, the blast may yield a mix of fines, oversize boulders, and inadequate intermediate sizes, which compromise both crusher compatibility and operational efficiency.

Approaches for Calculating Drill Hole Deviation (Manzoor et al., 2022)

Drill hole deviation refers to the departure of a drilled hole from its intended path in terms of length, direction, and angle. Accurate assessment of this deviation is essential in mining and civil engineering projects where the precision of hole placement affects fragmentation, blasting efficiency, and overall project outcomes. There are several practical approaches used to define and evaluate drill hole deviation, particularly focusing on hole length variation, toe deviation, and hole angle.

1. Hole Length Variation Approach

This approach compares the actual drilled hole length to the designed or planned length. In many cases, the planned length is measured from the collar (starting point) to the expected toe (bottom of the hole) along a straight path. Deviations in length often indicate that the drill has wandered off the intended path, especially in steeply inclined or deep holes.

  • Shorter holes than planned can suggest upward deviation or bending along the path.
  • Longer holes may indicate downward deviation or drilling past the toe due to misalignment or geological inconsistencies.

Monitoring length variation is particularly useful in controlled environments where design lengths are standardized. This method is a straightforward first check to determine if a hole might be deviating and to what extent.

2. Toe Deviation Approach

Toe deviation assesses the horizontal and vertical displacement of the actual hole end point (toe) from its intended or designed location. This is a direct measure of deviation and one of the most reliable indicators of drilling accuracy.

  • Toe deviation is typically evaluated using survey tools or borehole tracking systems that pinpoint the actual toe position.
  • Displacement in the horizontal plane indicates lateral drift.
  • Displacement in the vertical plane can suggest a variation in drilling dip or depth.

Understanding toe deviation is crucial in blast design and mineral exploration, where accurate positioning at the bottom of the hole influences rock breakage efficiency, ore recovery, and safety.

3. Hole Angle Deviation Approach

Angle deviation refers to the difference between the planned drill angle and the actual drilled angle. This can be assessed at various points along the hole but is especially important at the collar and near the toe.

  • Even small angle deviations can cause significant offset at the toe in long holes.
  • Deviations can occur in both the azimuth (horizontal angle) and the inclination (vertical angle), leading to spiraling or drifting holes.

Angle deviation is commonly tracked using a gyro or borehole camera, and its identification is vital in situations where hole alignment impacts the outcome, such as in perimeter control blasting or directional drilling.

Particle Size Distribution Consequences

Poor fragmentation due to drilling deviation leads to:

  • Increased presence of boulders that require secondary breaking.
  • Excessive fines that may cause dust problems and reduce haulage efficiency.
  • A wider particle size distribution (PSD) curve, indicating inefficient energy usage and poor blast performance.

Recommendation: Using WipFrag for Improvement

To mitigate the effects of drilling deviation and ensure consistent fragmentation, incorporating WipFrag image analysis software into the blast assessment process is highly recommended. WipFrag enables:

  • Real-time fragmentation analysis, helping to evaluate PSD curves right after the blast.
  • Identification of zones with excessive boulders or fines, linking these to potential drilling inaccuracies.
  • Comparison of multiple blast results to detect patterns in performance deviations caused by hole misalignment.

Using WipFrag’s specification envelope tool, engineers can assess if the fragmentation meets crusher compatibility standards and adjust their drilling and blasting parameters accordingly. Furthermore, integrating WipFrag into a continuous improvement cycle ensures better control over drilling precision, energy distribution, and overall blast performance.

Orthomosaic image of blast with heat map

Conclusion

Understanding the fundamentals of blasting goes beyond explosive placement, it demands accurate drilling. Drilling deviation disrupts the propagation of shock waves and leads to poor fragmentation, affecting both safety and productivity. Leveraging tools like WipFrag empowers mining professionals to monitor, analyze, and improve blast results, ensuring a more efficient and cost-effective operation.

References

Adebayo, B., & Mutandwa, B. (2015). Correlation of blast-hole deviation and area of block with fragment size and fragmentation cost. International Research Journal of Engineering and Technology (IRJET)2(7), 402-406.

Manzoor, S., Danielsson, M., Söderström, E., Schunnesson, H., Gustafson, A., Fredriksson, H., & Johansson, D. (2022). Predicting rock fragmentation based on drill monitoring: A case study from Malmberget mine, Sweden. Journal of the Southern African Institute of Mining and Metallurgy122(3), 155-165.

Reflex

WipWare Photoanalysis System FAQs

WipWare Photoanalysis logo, black background, FAQ with question marks in the center

We’ve put together some photoanalysis systems FAQs based on questions from our customers.

Does WipWare Technology give Real Time analysis results?

WipWare Image Analysis Systems produce real-time 24/7 results that allow personnel to identify, evaluate, and optimize troublesome areas of their process while maintaining production.
Our systems are installed in many different applications around the world. These applications vary from analyzing wood chips to detecting oversize material or contamination in diamond mines. The applications are endless.
From Mine to Mill
The term Mine to Mill highlights the importance of fragmentation data on both the blasting and processing end of operations. This term applies well to WipWare line of products from the muckpile after a blast to analyzing material on the conveyor.
Mine-to-mill technology takes the entire system into account, from the blasting process to the comminution circuit. This optimization provides a complete fragmentation and size reduction solution to maximize benefit.
WipFrag Image Analysis Software
WipWare’s WipFrag 4 Image Analysis Software effectively analyzes data from a recent blast and produces results of the blast material on-site in minutes.Man holding iPad tablet at rock face
Reflex Vehicle Analysis System
From there, as the trucks haul the material to the primary crusher, you can detect oversize material or contamination and divert the material accordingly.Truck going under an arch on a sandy gravel road
Once at the primary crusher, our Reflex systems can detect oversize material, contamination or give full particle size distribution analysis as the material is dumped.
Solo Conveyor Analysis System
After the material has gone through this process our systems can continue to analyze the material on the conveyor belt.

At this stage, you can determine what is the most important information you want to retrieve: detect oversize, divert material, identify contaminated material or receive full Particle Size Distribution data 24/7 in real-time.

Now, here’s the cool part: our WipFrag software is also the HMI (Human to Machine Interface) for our systems. Not only can you use our software separately to analyze your blast material, but the same software is also used to analyze your material all along its journey from Mine to Mill.


What are the benefits of WipWare products? 

Many potential customers ask this very question about the benefits of WipWare products. Well, here’s the answer.
WipWare offers industry-leading photoanalysis technology for accurate, real-time fragmentation assessment, optimizing blasting, crushing, and grinding operations. With features like deep learning, auto-scaling, GIS compatibility, and orthomosaic analysis, WipWare ensures precise measurement and continuous improvement. The software’s specification envelope, histogram reporting, and boulder counting enhance decision-making, reducing downtime and costs. Additionally, WipWare provides flexible pricing, cross-shipping warranties, and expert support, making it the top choice for efficient mining and aggregate operations.
Furthermore, our online Systems provide data to the customer 24/7 to identify troublesome areas of your process from Mine2mill.
In conclusion, our Solo Basic or Complete, Reflex Basic or Complete and WipFrag software can drastically lower energy, and maintenance costs, as-well as cut equipment downtime and aid in quality control.

How does WipWare’s volumetric feature work, and how can it save you money?

WipWare uses precise belt-depth detection lasers to detect both
A) Empty belts, as with previous Solo models
B) The depth of material on the conveyor belt
When you tie the material depth information with the conveyor belt speed and your belt weightometer reading, you are able to extract the specific gravity of the material passing. Having the specific gravity information will allow you to determine whether the material passing is waste or ore-bearing material. 
In preliminary tests at a limestone operation, WipWare was able to reach 94% correlation between the volumetric calculations and the belt weightometer readings.
An operation could use this information to divert waste material from entering the crushing process, saving significant amounts of money in maintenance and energy costs.
Volumetrics users have the added benefit of receiving accurate particle sizing results as well as another new feature allowing you to detect contamination.
With size, shape, volume and contamination detection data being streamed seamlessly in real-time, WipWare’s automated technologies are providing three times as much accurate data metrics than competitors.


What has WipWare technology been used for?

At WipWare, we often coin ourselves as a mining and aggregate technology provider, as these two industries make up the most of our business. The beauty of photoanalysis technologies, is that with a suitable image, our products can analyze anything from micron material to planets. We all know that automated particle sizing is a crucial part of the mining and aggregate industry, but as you will see, material size is not only important for rocks. Here are some of the cool applications we have had the pleasure of working with:
 Pebbles with a ruler to measure size in the bottom left corner
Mars Curiosity Rover: There may not be any mining on Mars (that we know of), but the Curiosity rover is taking pictures that are being analyzed for oversized obstacle detection. What a great way to identify and steer clear of obstacles and keep Curiosity roaming.
Scrambled eggs. That’s right, I said scrambled eggs. A food supplier from the US contacted us looking to optimize the fluffiness and fragmentation of the scrambled eggs they use. I’ll never look at scrambled eggs the same way ever again.
Processed kimberlite: Getting out of our chef’s apron and putting our hard hats back on, we have been working very closely with multiple diamond companies around the world to accurately analyze the process kimberlite material on their conveyor belts. What’s so incredible about this application? Well, it’s pretty normal, except for the fact that the material ranges from as low as 1.2mm (0.0472440″ for our Imperial friends). Once again, if a suitable image can be captured, WipWare can analyze it.
…And of course, we work with hundreds of applications that deal with broken screen detections, contamination, quality control procedures, pre- and post- crusher optimization and SAG mill throughput applications.


How can I see analysis (the) data?

Both Delta (Solo 6 and Reflex 6) and WipFrag produce a percentage passing curve visible after each virtual sieve analysis. It also saves the data to a CSV (comma-separated values) file. Each sieve analysis produces a new line in the CSV file that represents the results from the sieve.
This CSV file contains:
– Timestamp (Year/Month/Day/Hour/Minute/Second)
– D-values (XX% passed the specified size – Ex. 90% of the material passes 13.87 inches[352.30mm])
– User specified size classes (% passing or retained at the specified size)
– Block (amount of particle detected)
– Min, Max, Mean, St. Dev, Mode
– Sphericity (The shape of the material – 0=Linear Objects 1=Perfectly Round)
– Coverage (How much of the image is used)
– Calibration Values (b, Xmax, X50, Xc and n)
– EDP values (Edge Detection Values)
– Calibration factors
– System info (CPU temp, Board temp, Voltage checks)
– System uptime
– Camera setting at the time of the image.
– Modbus and OPC poll rate
– Vehicle Identification Information (Reflex Only)
Delta (Solo 6 and Reflex 6) can e-mail these CSV files automatically as well as an average of the entire day on one passing curve. It also has a trending graph in the lower section of the software interface which trends the data for the current day.
In addition, Delta has the ability to output the analysis information using a Modbus or OPC connection to pass information on to your historian, PLC or HMI.Chart with rocks on the left, chart on the right, System analysis at the bottom


What regular maintenance is required for WipWare Photoanalysis Systems?

The only regular maintenance required for our systems is to ensure the lens and lights are clean with as little dust/dirt as possible.
The frequency that the system will need to be cleaned will depend on the environment it operates in:
ENVIRONMENT/ FREQUENCY 
Very dusty 1-3 weeks
Moderate dust 2-6 weeks
Little or no dust 4-8 weeks
Method 1: Water hose 
The first method is the most common. Using a water hose, simply spray down the system ensuring the lens is clean and free of any noticeable dust or dirt. If possible, use a squeegee to remove any droplets that may remain on the lens. Doing this helps prevent dust from collecting in the droplets that remain which could leave deposits on the lens that interfere with image capture. Since our systems are completely waterproof this method is usually the easiest and most effective way to clean the lens. It can also be done without having to shut down the conveyor belt.
Method 2: Clean damp cloth/paper towel 
Another option is to use a clean damp cloth or paper towel with water or Windex. Using a clean microfiber cloth would be ideal, but those may be hard to find at mine sites. Try not to press to hard when wiping the lens, the accumulated dust could leave scratches in the lens if too much pressure is applied. Note: In sub Zero Temperatures refrain from using water or Windex as it will freeze to the lens and cause inadequate image quality. We recommend using standard windshield washer that is rated for the correct sub-zero temperature.
Method 3: Compressed air 
It’s also acceptable to use compressed air from a can or hose to dust off our systems. This method works well but will kick up a lot more dust than the liquid methods. We recommend using a dust mask when using compressed air to clean off out systems.


Can Delta (Solo 6 and Reflex 6) store the images captured by automated systems?

Simple answer is yes.
The computer can store up to 1000MB worth of images without any issues. Once beyond this point the hard drive could start having problems accessing the image folder causing the computer to run slower than normal, so the oldest images are overwritten automatically.
Note: All the particle size data is kept in a CSV file which is a much smaller size and allows you to store data over a longer timeline.
Most of our systems use a 1.2MP camera and the images average 180KB each, so 1000MB of storage can accommodate approximately 5600 images.
Running 24 hours per day the system can roughly save the following number of images:
If you are taking 1 image every 20 seconds you would have 4,320 images per day. ~31.2 hours
If you are taking 2 images every 20 seconds you would have 8,640 images per day. ~15.5 hours
If you are taking 3 images every 20 seconds you would have 12,960 images per day. ~10.3 hours


When should I apply Calibration to my analysis?

To calibrate, or not to calibrate; that is the question. And it’s an important question to ask prior to installing your online bulk material analysis system, regardless of the industry you’re in. Let’s help you figure out why calibration may or may not be your best bet, and whether you will see value in calibrating your system.
One of the deficiencies with image-based rock fragmentation analysis technology is the inability to analyze underlying material running on a conveyor belt. So, in normal circumstances, without calibration, fine material is typically under-represented when using image analysis. The same thing can be said for blast fragmentation analysis, but I will touch on this a little later in the article.
If photo analysis technologies represent material on the top layer, and under-represent the underlying material, an operation can compensate for this deficiency by calibrating. (For the how-to guide on calibration, check out this link).
The way I see it, without sounding too much like a broken record, calibrated photo analysis technologies take the best of both worlds: Quantity and quality.
Take the following scenario as an example: Company ABC wants to adjust the SAG feed based on particle size analysis. By doing so, they need to know when to draw fine material from the stockpile and when to draw coarser material. Calibration allows for the proper “mix” of bulk material in order to optimize the process.
The Swebrec and Rosin-Rammler functions are great for adjusting the distribution curve to accurately compensate for fine material… But what if you are looking strictly at the coarse sizes, say, for oversize detection?
If this is the case, you may want to reconsider the calibration process.
Allow me to explain:
A calibrated system is making certain assumptions about material underneath the top layer and may even bias your coarse material fractions when trying to adjust the distribution curve. So, if you are planning on having a conveyor belt shut down if it detects material over x size, you may want to reconsider taking the chance of biasing your results. Instead, an uncalibrated system is going to get you very useful data that will allow you to stop/start/act on out-of-spec readings and optimize your process.
What are other reasons why clients don’t calibrate?
When material is too large, it is much more difficult to manually sample material, and this could be cost-prohibitive. This issue arises most often on the blasting end of the application, where blast optimization relies heavily on detecting relative changes in material size.
For post-crusher analysis, some clients detect liner wearing by relative increases in the size of material, therefore making calibration unnecessary.
In summary, calibration certainly has its uses inside the mining and aggregate industries, and more specifically, when finer material sizes are a necessary part of the quandary; however, uncalibrated systems are still very useful in optimizing your process and for tracking relative change.


What is WipWare’s warranty policy?

WipWare Inc. provides a one-year limited warranty on all products, including components and software. To offer customers peace of mind, WipWare also offers an annual service contract, which includes exclusive technician service rates, monthly check-ins, extended system warranties, and more.
With the purchase of any WipWare photoanalysis product, the warranty covers cross-shipping for any defective product under the WipWare Limited Warranty, ensuring minimal downtime for customers.
For full WipWare Limited Warranty details see here.


How does WipWare facilitate training for its unique products?

WipWare goes above and beyond to ensure that not only customers, but any individual or company who may show interest in a WipWare product has the utmost training and confidence when it comes to utilizing our extensive line of photoanalysis systems. WipWare offers free training to individuals, companies, colleges, and universities interested in learning about our products. We recently conducted on-campus workshops for mining students at Queen’s University (Kingston), Laurentian University (Sudbury), and ÉTS University (Montreal). In addition to in-person sessions, we provide virtual training and have a library of training videos available for easy access.Mining students in photo learning WipFrag
For more information about WipWare training please contact support@wipware.com

For more information about our systems, please visit our YouTube channel.

WipFrag

WipFrag 4 FAQ!

We’ve put together some FAQs for WipFrag 4 image acquisition based on questions from our customers.

I have purchased WipFrag software and have a few questions about the proper acquisition of photographs to be used with this software?

For accurate fragmentation analysis with WipFrag, follow these key guidelines when capturing images:
Proper Scaling – Use a scale object (e.g., a known-sized object) in each image to ensure accurate measurements unless using auto-scaling.
Good Lighting – Avoid shadows and overexposed areas to maintain clear rock particle visibility.
Correct Angle & Distance –Stand at any distance where the biggest particle occupies 20% of the image.
Sufficient Coverage – Capture multiple images to represent the entire fragmentation distribution, avoiding overly distant shots. WipFrag has the merging feature to help combine all the images in a single result.
High Resolution – Use a good-quality camera to ensure sharp images with clear particle edges.
The expert photographers and software designers here at WipWare have put together a helpful and insightful document correctively named “The Sampling and Analysis Guide”.
This document is available in the Products and Services section of the WipWare website (download here: https://wipware.com/wp-content/uploads/2021/06/Sampling-and-Analysis-Guide-2021.pdf)


When is the best time to take pictures of outdoor material?

Avoid capturing images early in the morning or late in the evening, as the low sun creates long shadows around particles, particularly oversized ones. This can make it difficult to identify an EDP and increase manual editing time.
For optimal results, take images late in the morning or early in the afternoon, especially on overcast days. The even lighting during these times produces soft, uniform shadows, making EDP detection easier and significantly reducing the need for manual adjustments.


What is False positive in Image analysis?

A false positive occurs when your analysis contains either a fusion or disintegration error. A fusion error happens when two or more particles are mistakenly merged into one, while a disintegration error occurs when a single particle is incorrectly fragmented into multiple pieces.


What is the recommended way to manually edit analysis on WipFrag?

We recommend that you first use the deep learning EDP.
To improve the particle delineation, activate the edit assist tool, to show you the 50 biggest particles.
1. When you find disintegration errors, you have two options:
a. Use the ‘Lasso Delete & Outline’ tool (Tool No. 5) to trace around the entire particle. This tool will delete any net within the shape you drew and will draw net along the line you traced.
b. Use the ‘Block Delete’ tool to quickly delete unnecessary net without deleting the net that is correctly surrounding the particle. This can usually be faster than tracing the entire particle using ‘Lasso Delete & Outline’.
Rocks showing edge detection
c. When you find a fusion error, use the ‘Free Draw’ tool to draw a line along missing edges.
Simply repeat the above until satisfied.


How does WipWare facilitate training for its unique products?

WipWare goes above and beyond to ensure that not only customers, but any individual or company who may show interest in a WipWare product has the utmost training and confidence when it comes to utilizing our extensive line of photoanalysis systems. WipWare offers free training to individuals, companies, colleges, and universities interested in learning about our products. We recently conducted on-campus workshops for mining students at Queen’s University (Kingston), Laurentian University (Sudbury), and ÉTS University (Montreal). In addition to in-person sessions, we provide virtual training and have a library of training videos available for easy access.Mining students in photo learning WipFrag
For more information about WipWare training please contact support@wipware.com


Can WipFrag 4 be used for simple Drill and Blast simulation?

Yes. WipFrag 4 has a module called BlastCast using KCO model for simulation of blast parameters. This model used both controllable and uncontrollable parameters to predict PSD.

The easiest way to obtain particle size distribution data from a photograph is to download WipFrag 4 on your mobile device. Simply open the app, capture an image of the material, analyze it using WipFrag’s advanced processing tools, and receive accurate size distribution results within minutes.


How can I analysis large blasting with WipFrag 4?

There are two methods for analyzing large blasts using WipFrag 4. The first method involves using drone images, where the software generates an orthomosaic from UAV-captured images. orthomosaic image of blasted rock with generated blue net around the particles
The second method allows you to capture multiple images and merge them within WipFrag 4, providing an average result across all images for a comprehensive analysis.


Can I compare multiple blast results on WipFrag 4?

Yes, select all blast images in the WipFrag workspace, click the three dots in the upper corner, and choose “Merge and View Chart” to display the PSD. The software will present all blast PSDs on a single chart for easy comparison.

For more information about WipFrag, please visit our YouTube channel. Tutorial videos are available on a variety of WipFrag topics.