WipFrag

WipFrag

Understanding the Fundamentals of Blasting and Fragmentation Part 2

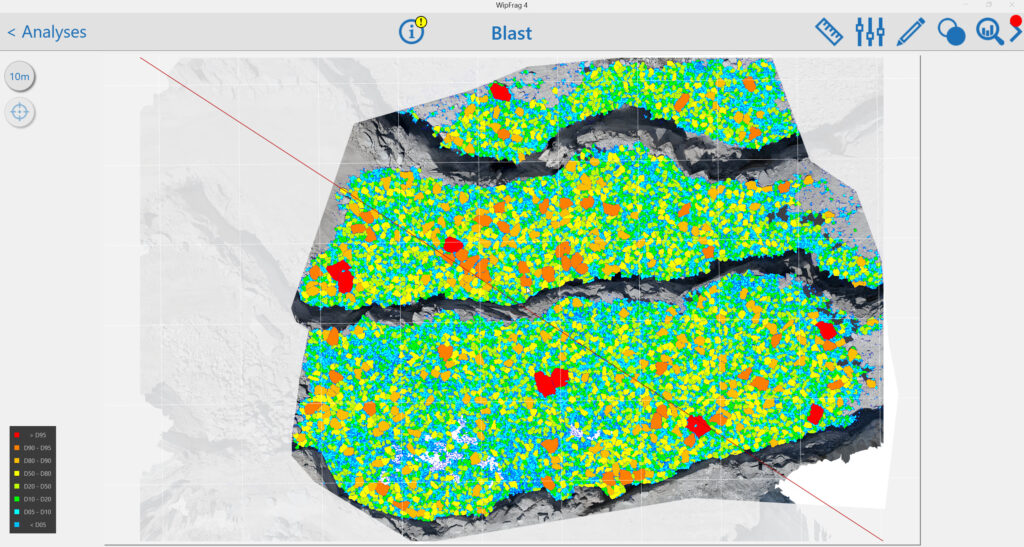
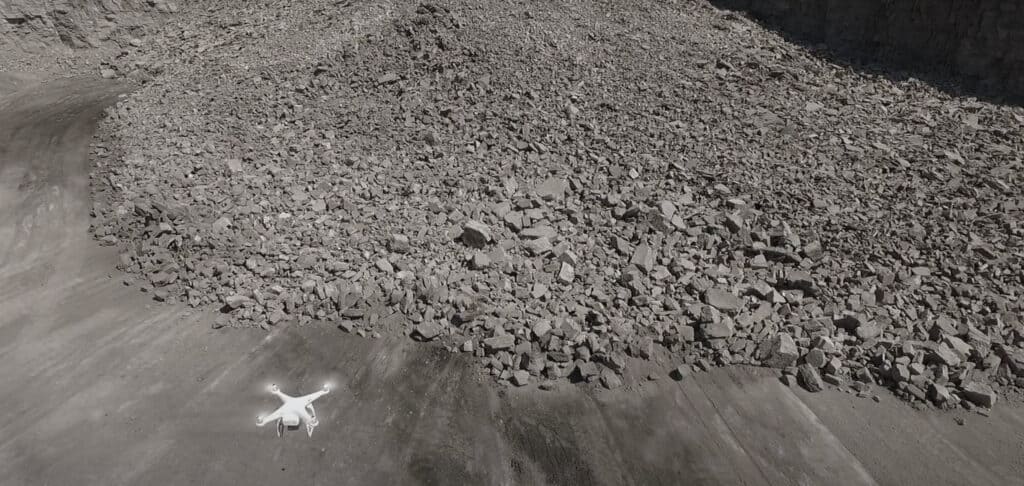
Overview of blast showing bore holes

Blasting and fragmentation are critical operations in mining and quarrying, significantly influencing downstream processes such as loading, hauling, and crushing. At the core of successful blasting lies a precise understanding of how energy is distributed through the rock mass. Among the key factors that can drastically affect blast outcomes is drilling deviation, a common but often underestimated issue that alters the intended blast geometry.

The Impact of Drilling Deviation

In an ideal blast design, drill holes are positioned and angled according to a specific pattern to ensure optimal burden spacing, energy distribution, and shock wave interaction. However, drilling deviation, which refers to the unintentional displacement or misalignment of blast holes can disrupt this pattern (Adebayo & Mutandwa, 2015).
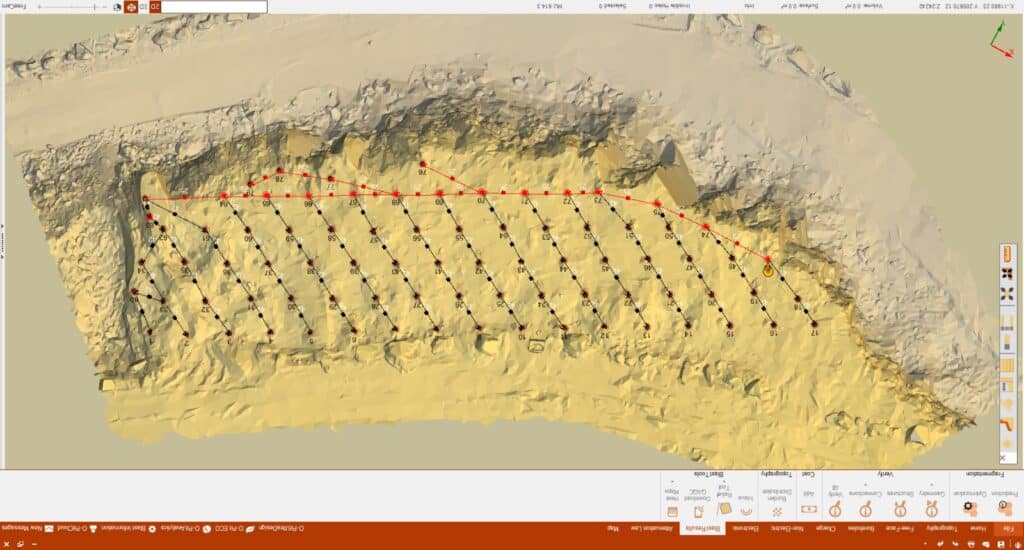
Overview of blast showing bore holes

When holes deviate, the spacing and burden between them can become inconsistent. This misalignment affects shock wave propagation, leading to uneven energy transfer across the rock mass. In zones where spacing is too wide, the energy dissipates prematurely, resulting in poor rock breakage. Conversely, overly tight spacing can cause excessive energy concentration, increasing the risk of overbreak and flyrock.

These irregularities directly influence rock fracturing. A well-fractured rock mass ensures the production of uniformly sized fragments. But with drilling deviation, fragmentation becomes unpredictable. As a result, the blast may yield a mix of fines, oversize boulders, and inadequate intermediate sizes, which compromise both crusher compatibility and operational efficiency.

Approaches for Calculating Drill Hole Deviation (Manzoor et al., 2022)

Drill hole deviation refers to the departure of a drilled hole from its intended path in terms of length, direction, and angle. Accurate assessment of this deviation is essential in mining and civil engineering projects where the precision of hole placement affects fragmentation, blasting efficiency, and overall project outcomes. There are several practical approaches used to define and evaluate drill hole deviation, particularly focusing on hole length variation, toe deviation, and hole angle.

1. Hole Length Variation Approach

This approach compares the actual drilled hole length to the designed or planned length. In many cases, the planned length is measured from the collar (starting point) to the expected toe (bottom of the hole) along a straight path. Deviations in length often indicate that the drill has wandered off the intended path, especially in steeply inclined or deep holes.

  • Shorter holes than planned can suggest upward deviation or bending along the path.
  • Longer holes may indicate downward deviation or drilling past the toe due to misalignment or geological inconsistencies.

Monitoring length variation is particularly useful in controlled environments where design lengths are standardized. This method is a straightforward first check to determine if a hole might be deviating and to what extent.

2. Toe Deviation Approach

Toe deviation assesses the horizontal and vertical displacement of the actual hole end point (toe) from its intended or designed location. This is a direct measure of deviation and one of the most reliable indicators of drilling accuracy.

  • Toe deviation is typically evaluated using survey tools or borehole tracking systems that pinpoint the actual toe position.
  • Displacement in the horizontal plane indicates lateral drift.
  • Displacement in the vertical plane can suggest a variation in drilling dip or depth.

Understanding toe deviation is crucial in blast design and mineral exploration, where accurate positioning at the bottom of the hole influences rock breakage efficiency, ore recovery, and safety.

3. Hole Angle Deviation Approach

Angle deviation refers to the difference between the planned drill angle and the actual drilled angle. This can be assessed at various points along the hole but is especially important at the collar and near the toe.

  • Even small angle deviations can cause significant offset at the toe in long holes.
  • Deviations can occur in both the azimuth (horizontal angle) and the inclination (vertical angle), leading to spiraling or drifting holes.

Angle deviation is commonly tracked using a gyro or borehole camera, and its identification is vital in situations where hole alignment impacts the outcome, such as in perimeter control blasting or directional drilling.

Particle Size Distribution Consequences

Poor fragmentation due to drilling deviation leads to:

  • Increased presence of boulders that require secondary breaking.
  • Excessive fines that may cause dust problems and reduce haulage efficiency.
  • A wider particle size distribution (PSD) curve, indicating inefficient energy usage and poor blast performance.

Recommendation: Using WipFrag for Improvement

To mitigate the effects of drilling deviation and ensure consistent fragmentation, incorporating WipFrag image analysis software into the blast assessment process is highly recommended. WipFrag enables:

  • Real-time fragmentation analysis, helping to evaluate PSD curves right after the blast.
  • Identification of zones with excessive boulders or fines, linking these to potential drilling inaccuracies.
  • Comparison of multiple blast results to detect patterns in performance deviations caused by hole misalignment.

Using WipFrag’s specification envelope tool, engineers can assess if the fragmentation meets crusher compatibility standards and adjust their drilling and blasting parameters accordingly. Furthermore, integrating WipFrag into a continuous improvement cycle ensures better control over drilling precision, energy distribution, and overall blast performance.
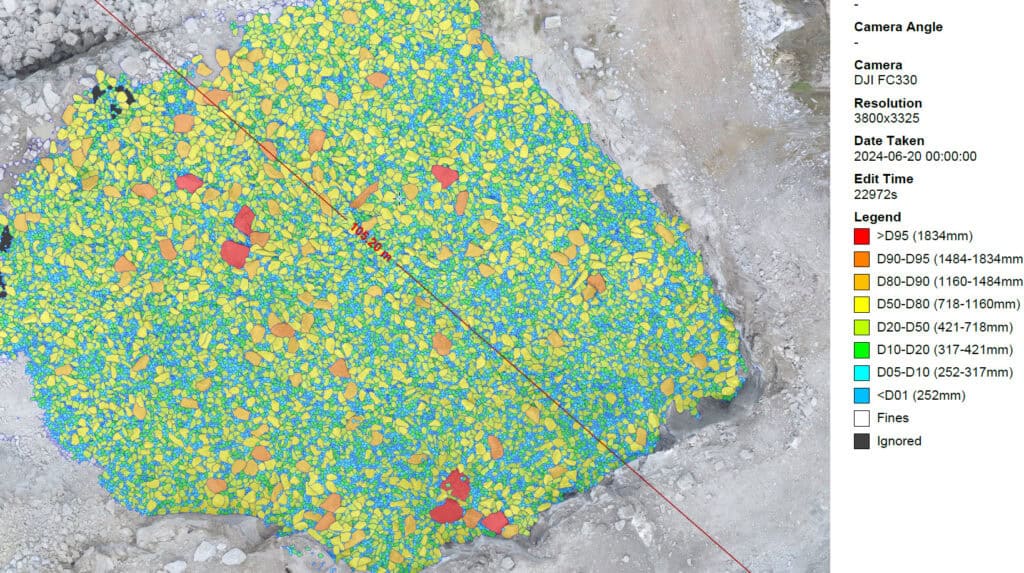
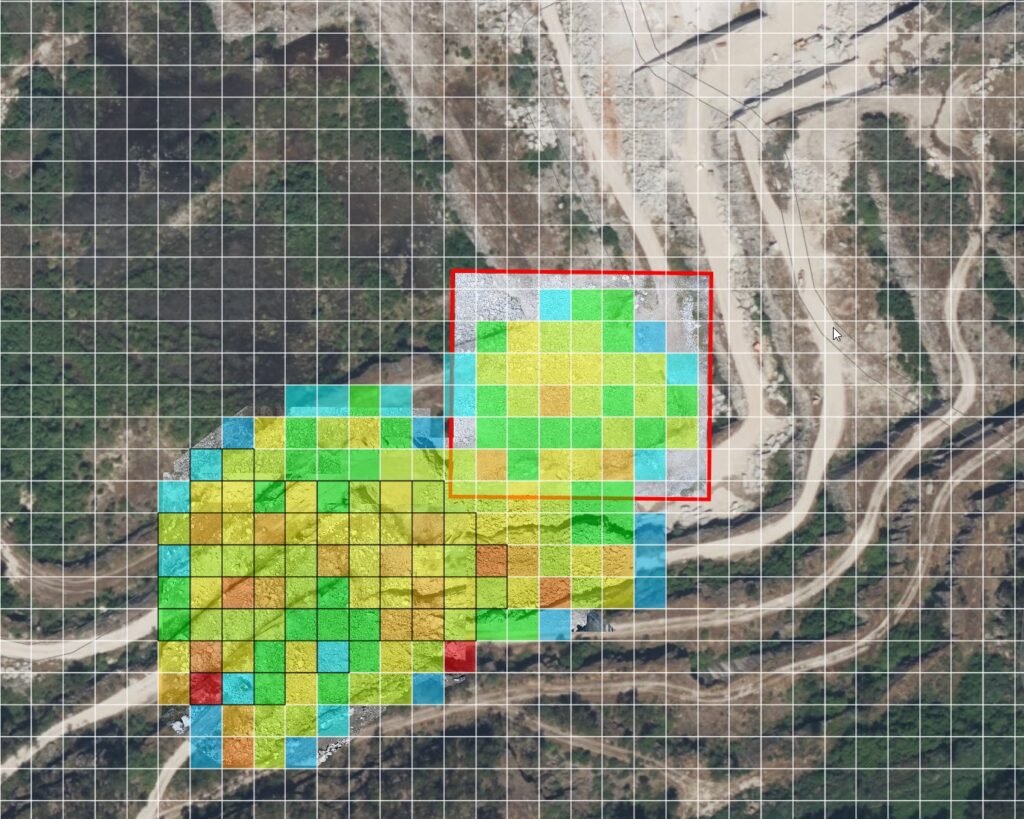
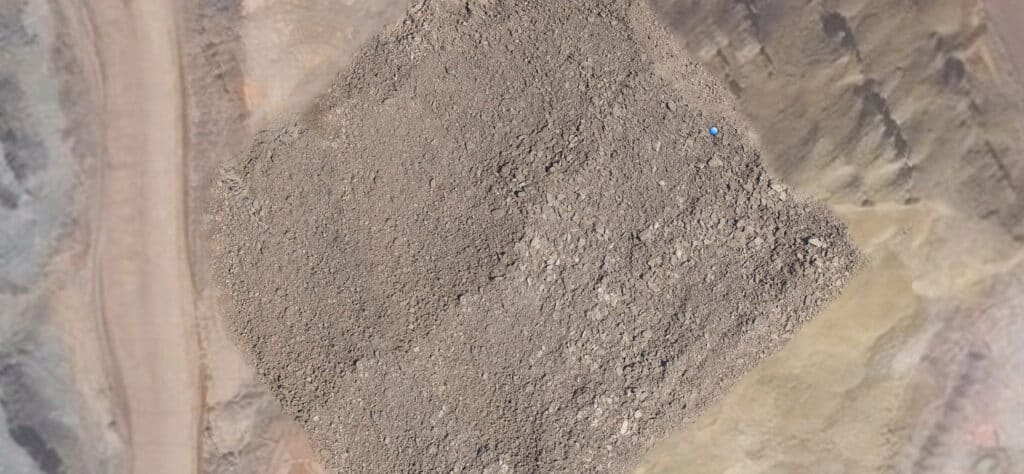
Orthomosaic image of blast with heat map

Conclusion

Understanding the fundamentals of blasting goes beyond explosive placement, it demands accurate drilling. Drilling deviation disrupts the propagation of shock waves and leads to poor fragmentation, affecting both safety and productivity. Leveraging tools like WipFrag empowers mining professionals to monitor, analyze, and improve blast results, ensuring a more efficient and cost-effective operation.

References

Adebayo, B., & Mutandwa, B. (2015). Correlation of blast-hole deviation and area of block with fragment size and fragmentation cost. International Research Journal of Engineering and Technology (IRJET)2(7), 402-406.

Manzoor, S., Danielsson, M., Söderström, E., Schunnesson, H., Gustafson, A., Fredriksson, H., & Johansson, D. (2022). Predicting rock fragmentation based on drill monitoring: A case study from Malmberget mine, Sweden. Journal of the Southern African Institute of Mining and Metallurgy122(3), 155-165.

Réflexe

Understanding the Fundamentals of Blasting and Fragmentation – Part 1

Introduction

Blasting is a critical operation in mining, quarrying, and construction that involves the controlled detonation of explosives to break rock into manageable fragments. The fundamental principle behind blasting lies in understanding the interaction between explosive energy and rock mechanics, particularly the propagation of shock waves and the subsequent formation of fractures.

The Shock-Wave Theory of Blasting

The shock-wave theory provides a framework for understanding how explosive energy transforms into mechanical work, breaking the rock. As mentioned by Hino, (1956), when an explosive charge detonates, it generates an intense shock wave accompanied by a rapid release of gas and energy.

This energy produces two primary effects:

1. Crushed Zone Formation:

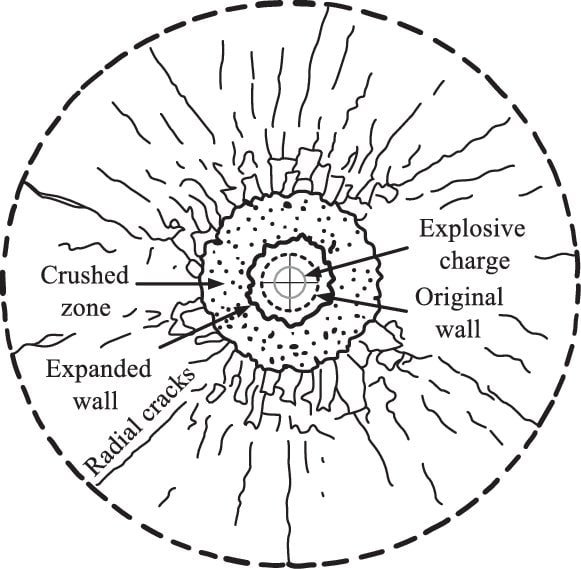
Near the explosive charge, the rock undergoes intense compressive stress, exceeding its compressive strength. This creates a crushed zone, a region where the rock is pulverized into fine fragments. However, because rocks generally have a high compressive strength, this crushed zone is limited to the immediate vicinity of the charge.

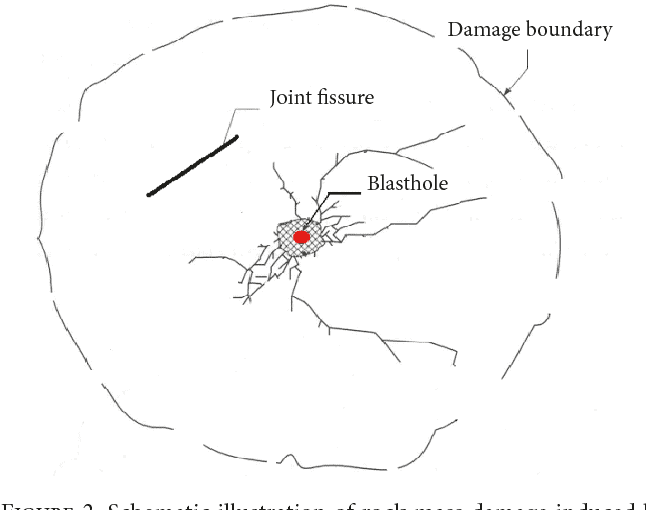
Figure 1 )Shadab Far et al., 2019)

2. Shock Wave Propagation:

Beyond the crushed zone, a high-pressure shock wave propagates outward as a compressive wave. This wave does not immediately cause rock breakage but transfers energy through the rock mass.

At the first free face (a boundary with no external constraint, such as the surface of a bench or tunnel wall), the compressive wave reflects as a tensile wave. In rock mechanics, this transition is crucial because rocks are significantly weaker under tensile stress than under compressive stress. As the tensile wave interacts with the rock, fractures form when the effective tension the difference between the reflected tensile wave and any residual compression exceeds the rock’s tensile strength (Himanshu et al., 2024).

compressive waves from a blast

Thickness of the First Slab and Fragmentation

The initial fracture caused by the tensile wave occurs at a distance from the free face known as the thickness of the first slab (Hino, 1956). This distance is critical because:

  • It determines the size of the initial fragment.
  • Other fragment dimensions are generally proportional to this thickness.

If the remaining compressive wave retains sufficient energy after the detachment of the first slab, it continues propagating outward (See Figure 2). This process repeats at newly created free faces, producing successive layers of fractures and reducing the rock into smaller fragments. The cycle continues until the energy of the compressive wave diminishes below the tensile strength of the rock.

The interaction between these phenomena: shock wave propagation, energy dissipation, and rock strength, governs the fragmentation process. Understanding these principles allows blasting engineers to optimize blast designs to achieve desired fragment sizes, minimize blast induced issues like ground vibration, flyrock, overbreak, and ensure efficient downstream operations.

Factors Affecting Shock-Wave Propagation and Fragmentation

Several factors influence the effectiveness of a blast and the resulting fragmentation:

1. Explosive Properties

  • The energy content, detonation velocity, and confinement of explosives significantly affect the shock wave’s intensity and duration.

2. Rock Properties

  • Variations in rock strength, density, and structure (e.g., joints, fractures, and bedding planes) influence the propagation of shock and tensile waves.

3. Blast Design Parameters:

  • Hole diameter, spacing, burden, and the placement of charges determine the distribution of energy and the resulting fragmentation.

4. Free Face Orientation:

  • The presence and orientation of free faces play a pivotal role in enabling tensile wave reflection and fracture initiation.

5. Energy Distribution:

  • Proper distribution of explosive energy ensures uniform fragmentation and minimizes the generation of oversize boulders or fines.

Importance of Fragmentation in Mining Operations

Effective fragmentation is essential for the efficiency and cost-effectiveness of mining operations. Well-fragmented rock facilitates:

  • Reduced loading and hauling costs.
  • Improved crusher throughput and efficiency.
  • Lower energy consumption in downstream processing.
  • Enhanced safety by minimizing the occurrence of hazardous oversize boulders.

Importance of Assessing Blast Performance and Output

WipFrag, a state-of-the-art image analysis software, revolutionizes the assessment of blast performance and fragmentation. By analyzing images of fragmented rock, WipFrag provides precise and actionable insights into the quality of a blast. Here’s how WipFrag enhances blasting operations:

1. Particle Size distribution (PSD) Analysis:

  • WipFrag generates PSD curves that quantify the size range of rock fragments, enabling operators to evaluate whether the fragmentation meets specifications.

2. Specification Envelope Assessment

  • The software allows users to define specification envelopes for crusher-compatible fragmentation. Deviations from these envelopes highlight areas for improvement in blast design.

3. Boulder Identification and Counting:

  • WipFrag’s advanced algorithms detect and count oversize boulders, providing critical data for optimizing explosive placement and burden.

4. Image Merging and Orthomosaic Integration:

  • The capability to merge multiple images ensures comprehensive analysis of large muck piles. Integration with drone orthomosaics enables wide-area assessment of blast results.

5. Continuous Improvement:

  • By comparing fragmentation results across blasts, WipFrag supports continuous improvement in blasting practices, reducing costs and improving efficiency.

6. Real-Time Analysis:

  • Integration with systems like Solo 6 and Reflex 6 facilitates real-time monitoring and analysis, ensuring immediate feedback for decision-making.
Fragmentation analysis chart, material size, percent passing, histogram chart

Figure 3

Figure 3 showcases results obtained from the WipFrag software, illustrating its capabilities in fragmentation analysis.

  • Figure 3a presents the GIS-integrated on-site fragmentation assessment. This feature, embedded within WipFrag, allows users to visualize blast results spatially. The red sections of the GIS map highlight areas with poor blast outcomes, whereas lighter colors like blue and green represent zones with favorable fragmentation.
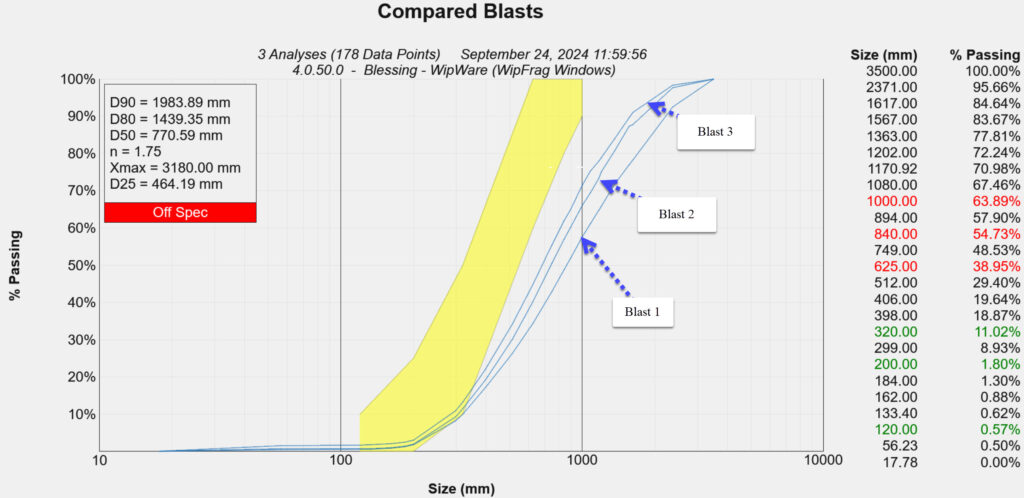
  • Figure 3c displays the Particle Size Distribution (PSD) curves comparing three different blasts. The yellow envelope outlines the production specification of the case study mine, serving as a benchmark. WipFrag enables each mine to define their Key Performance Indicator (KPI) sizes and utilize them for ongoing assessments. This facilitates the evaluation of blast improvements over successive rounds.
  • Additionally, the PSD curves feature size classifications and flag specific sizes that deviate from mine production requirements, ensuring precise monitoring and alignment with operational goals.

This comprehensive analysis provided by WipFrag aids in identifying areas of improvement, optimizing blasting strategies, and enhancing overall mining efficiency.

Conclusion

Blasting and fragmentation are complex processes driven by the interaction of explosive energy, rock mechanics, and blast design parameters. Understanding these fundamentals is essential for optimizing operations and achieving desired outcomes. WipFrag software plays a pivotal role in this optimization by providing detailed and accurate fragmentation analysis, enabling operators to assess performance, identify areas for improvement, and implement data-driven strategies for continuous enhancement. With tools like WipFrag, the mining industry can achieve safer, more efficient, and cost-effective blasting operations (download software here https://wipware.com/get-wipfrag/).

References

Hino, K. (1956). Fragmentation of rock through blasting and shock wave theory of blasting. In ARMA US Rock Mechanics/Geomechanics Symposium (pp. ARMA-56). ARMA.

Himanshu, V. K., Bhagat, N. K., Vishwakarma, A. K., & Mishra, A. K. (2024). Principles and Practices of Rock Blasting. CRC Press.

Shadab Far, M., Wang, Y., & Dallo, Y. A. (2019). Reliability analysis of the induced damage for single-hole rock blasting. Georisk: Assessment and Management of Risk for Engineered Systems and Geohazards13(1), 82-98.

Réflexe

WipWare Photoanalysis System FAQs

WipWare Photoanalysis logo, black background, FAQ with question marks in the center

We’ve put together some photoanalysis systems FAQs based on questions from our customers.

Does WipWare Technology give Real Time analysis results?

WipWare Image Analysis Systems produce real-time 24/7 results that allow personnel to identify, evaluate, and optimize troublesome areas of their process while maintaining production.
Our systems are installed in many different applications around the world. These applications vary from analyzing wood chips to detecting oversize material or contamination in diamond mines. The applications are endless.
From Mine to Mill
The term Mine to Mill highlights the importance of fragmentation data on both the blasting and processing end of operations. This term applies well to WipWare line of products from the muckpile after a blast to analyzing material on the conveyor.
Mine-to-mill technology takes the entire system into account, from the blasting process to the comminution circuit. This optimization provides a complete fragmentation and size reduction solution to maximize benefit.
Logiciel d'analyse d'images WipFrag
WipWare’s WipFrag 4 Image Analysis Software effectively analyzes data from a recent blast and produces results of the blast material on-site in minutes.Man holding iPad tablet at rock face
Système d'analyse de véhicule Reflex
From there, as the trucks haul the material to the primary crusher, you can detect oversize material or contamination and divert the material accordingly.Truck going under an arch on a sandy gravel road
Once at the primary crusher, our Reflex systems can detect oversize material, contamination or give full particle size distribution analysis as the material is dumped.
Système d'analyse de convoyeur solo
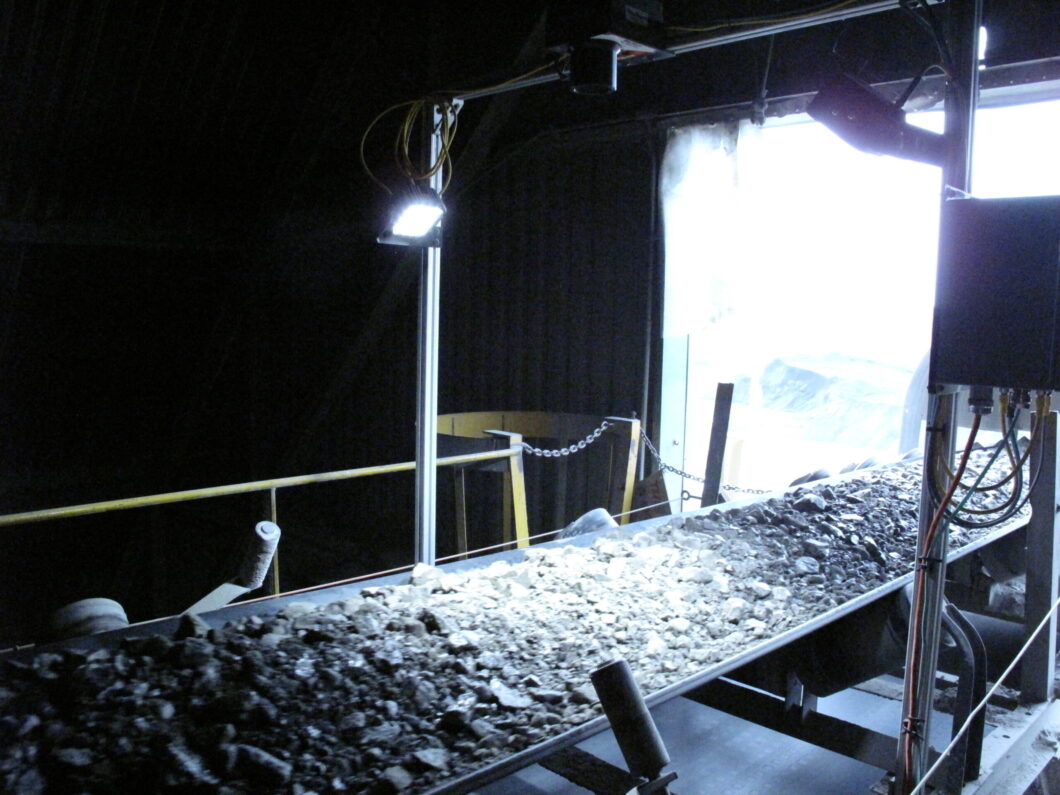
After the material has gone through this process our systems can continue to analyze the material on the conveyor belt.

At this stage, you can determine what is the most important information you want to retrieve: detect oversize, divert material, identify contaminated material or receive full Particle Size Distribution data 24/7 in real-time.

Now, here’s the cool part: our WipFrag software is also the HMI (Human to Machine Interface) for our systems. Not only can you use our software separately to analyze your blast material, but the same software is also used to analyze your material all along its journey from Mine to Mill.


What are the benefits of WipWare products? 

Many potential customers ask this very question about the benefits of WipWare products. Well, here’s the answer.
WipWare offers industry-leading photoanalysis technology for accurate, real-time fragmentation assessment, optimizing blasting, crushing, and grinding operations. With features like deep learning, auto-scaling, GIS compatibility, and orthomosaic analysis, WipWare ensures precise measurement and continuous improvement. The software’s specification envelope, histogram reporting, and boulder counting enhance decision-making, reducing downtime and costs. Additionally, WipWare provides flexible pricing, cross-shipping warranties, and expert support, making it the top choice for efficient mining and aggregate operations.
Furthermore, our online Systems provide data to the customer 24/7 to identify troublesome areas of your process from Mine2mill.
In conclusion, our Solo Basic or Complete, Réflexe Basic or Complete and WipFrag software can drastically lower energy, and maintenance costs, as-well as cut equipment downtime and aid in quality control.

Comment fonctionne la fonction volumétrique de WipWare et comment peut-elle vous faire économiser de l'argent ?

WipWare utilise des lasers de détection de profondeur de ceinture précis pour détecter à la fois
A) Courroies vides, comme avec les modèles Solo précédents
B) La profondeur de matériau sur la bande transporteuse
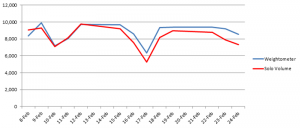
When you tie the material depth information with the conveyor belt speed and your belt weightometer reading, you are able to extract the specific gravity of the material passing. Having the specific gravity information will allow you to determine whether the material passing is waste or ore-bearing material. 
Lors de tests préliminaires dans une opération de calcaire, WipWare a pu atteindre une corrélation de 94% entre les calculs volumétriques et les lectures du peseur de la bande.
Une exploitation pourrait utiliser ces informations pour empêcher les déchets d'entrer dans le processus de concassage, ce qui permettrait d'économiser des sommes importantes en coûts d'entretien et d'énergie.
Volumetrics users have the added benefit of receiving accurate particle sizing results as well as another new feature allowing you to detect contamination.
Les données de détection de taille, de forme, de volume et de contamination étant diffusées de manière transparente en temps réel, les technologies automatisées de WipWare fournissent des mesures de données trois fois plus précises que celles de ses concurrents.


What has WipWare technology been used for?

Chez WipWare, nous nous présentons souvent comme un fournisseur de technologies minières et d'agrégats, car ces deux secteurs constituent l'essentiel de notre activité. La beauté des technologies de photoanalyse, c'est qu'avec une image appropriée, nos produits peuvent analyser n'importe quoi, du micron aux planètes. Nous savons tous que la granulométrie automatisée est un élément crucial de l'industrie minière et des agrégats, mais comme vous le verrez, la taille des matériaux n'est pas seulement importante pour les roches. Voici quelques-unes des applications intéressantes avec lesquelles nous avons eu le plaisir de travailler :
 Pebbles with a ruler to measure size in the bottom left corner
Rover Curiosity de Mars : There may not be any mining on Mars (that we know of), but the Curiosity rover is taking pictures that are being analyzed for oversized obstacle detection. What a great way to identify and steer clear of obstacles and keep Curiosity roaming.
Oeufs brouillés. That’s right, I said scrambled eggs. A food supplier from the US contacted us looking to optimize the fluffiness and fragmentation of the scrambled eggs they use. I’ll never look at scrambled eggs the same way ever again.
Kimberlite traitée : Getting out of our chef’s apron and putting our hard hats back on, we have been working very closely with multiple diamond companies around the world to accurately analyze the process kimberlite material on their conveyor belts. What’s so incredible about this application? Well, it’s pretty normal, except for the fact that the material ranges from as low as 1.2mm (0.0472440″ for our Imperial friends). Once again, if a suitable image can be captured, WipWare can analyze it.
…And of course, we work with hundreds of applications that deal with broken screen detections, contamination, quality control procedures, pre- and post- crusher optimization and SAG mill throughput applications.


How can I see analysis (the) data?

Both Delta (Solo 6 and Reflex 6) and WipFrag produce a percentage passing curve visible after each virtual sieve analysis. It also saves the data to a CSV (comma-separated values) file. Each sieve analysis produces a new line in the CSV file that represents the results from the sieve.
Ce fichier CSV contient :
– Timestamp (Year/Month/Day/Hour/Minute/Second)
– D-values (XX% passed the specified size – Ex. 90% of the material passes 13.87 inches[352.30mm])
– User specified size classes (% passing or retained at the specified size)
– Block (amount of particle detected)
– Min, Max, Mean, St. Dev, Mode
– Sphericity (The shape of the material – 0=Linear Objects 1=Perfectly Round)
– Coverage (How much of the image is used)
– Calibration Values (b, Xmax, X50, Xc and n)
– EDP values (Edge Detection Values)
– Calibration factors
– System info (CPU temp, Board temp, Voltage checks)
– System uptime
– Camera setting at the time of the image.
– Modbus and OPC poll rate
– Vehicle Identification Information (Reflex Only)
Delta (Solo 6 and Reflex 6) can e-mail these CSV files automatically as well as an average of the entire day on one passing curve. It also has a trending graph in the lower section of the software interface which trends the data for the current day.
De plus, Delta a la capacité de sortir les informations d'analyse à l'aide d'une connexion Modbus ou OPC pour transmettre les informations à votre historien, API ou IHM.Chart with rocks on the left, chart on the right, System analysis at the bottom


Quel entretien régulier est nécessaire pour les systèmes de photoanalyse WipWare ?

Le seul entretien régulier requis pour nos systèmes est de s'assurer que la lentille et les lumières sont propres avec le moins de poussière/saleté possible.
La fréquence à laquelle le système devra être nettoyé dépendra de l'environnement dans lequel il fonctionne :
ENVIRONNEMENT/ FRÉQUENCE 
Très poussiéreux 1-3 semaines
Poussière modérée 2-6 semaines
Peu ou pas de poussière 4-8 semaines
Méthode 1 : tuyau d'arrosage 
The first method is the most common. Using a water hose, simply spray down the system ensuring the lens is clean and free of any noticeable dust or dirt. If possible, use a squeegee to remove any droplets that may remain on the lens. Doing this helps prevent dust from collecting in the droplets that remain which could leave deposits on the lens that interfere with image capture. Since our systems are completely waterproof this method is usually the easiest and most effective way to clean the lens. It can also be done without having to shut down the conveyor belt.
Méthode 2 : nettoyer un chiffon humide/une serviette en papier 
Une autre option consiste à utiliser un chiffon propre et humide ou une serviette en papier avec de l'eau ou du Windex. L'idéal serait d'utiliser un chiffon en microfibre propre, mais ceux-ci peuvent être difficiles à trouver sur les sites miniers. Essayez de ne pas appuyer trop fort lorsque vous essuyez l'objectif, la poussière accumulée pourrait laisser des rayures dans l'objectif si une pression trop forte est appliquée. Remarque : À des températures inférieures à zéro, évitez d'utiliser de l'eau ou du Windex car cela gèlerait sur l'objectif et entraînerait une qualité d'image inadéquate. Nous vous recommandons d'utiliser un lave-glace standard conçu pour la bonne température inférieure à zéro.
Méthode 3 : Air comprimé 
It’s also acceptable to use compressed air from a can or hose to dust off our systems. This method works well but will kick up a lot more dust than the liquid methods. We recommend using a dust mask when using compressed air to clean off out systems.


Can Delta (Solo 6 and Reflex 6) store the images captured by automated systems?

La réponse simple est oui.
The computer can store up to 1000MB worth of images without any issues. Once beyond this point the hard drive could start having problems accessing the image folder causing the computer to run slower than normal, so the oldest images are overwritten automatically.
Remarque : Toutes les données sur la taille des particules sont conservées dans un fichier CSV qui est beaucoup plus petit et vous permet de stocker les données sur une plus longue période.
La plupart de nos systèmes utilisent un appareil photo de 1,2 MP et les images font en moyenne 180 Ko chacune, donc 1 000 Mo de stockage peuvent accueillir environ 5 600 images.
Running 24 hours per day the system can roughly save the following number of images:
Si vous prenez 1 image toutes les 20 secondes, vous auriez 4 320 images par jour. ~31,2 heures
Si vous prenez 2 images toutes les 20 secondes, vous auriez 8 640 images par jour. ~15,5 heures
Si vous prenez 3 images toutes les 20 secondes, vous auriez 12 960 images par jour. ~10,3 heures


When should I apply Calibration to my analysis?

To calibrate, or not to calibrate; that is the question. And it’s an important question to ask prior to installing your online bulk material analysis system, regardless of the industry you’re in. Let’s help you figure out why calibration may or may not be your best bet, and whether you will see value in calibrating your system.
L'une des lacunes de la technologie d'analyse de la fragmentation des roches basée sur l'image est l'incapacité d'analyser le matériau sous-jacent circulant sur une bande transporteuse. Ainsi, dans des circonstances normales, sans étalonnage, les matériaux fins sont généralement sous-représentés lors de l'utilisation de l'analyse d'images. La même chose peut être dite pour l'analyse de fragmentation de souffle, mais j'y reviendrai un peu plus loin dans l'article.
Si les technologies d'analyse photographique représentent du matériau sur la couche supérieure, et sous-représentent le matériau sous-jacent, une opération peut compenser cette déficience en calibrant. (Pour le guide pratique sur l'étalonnage, consultez ce lien).
The way I see it, without sounding too much like a broken record, calibrated photo analysis technologies take the best of both worlds: Quantity and quality.
Take the following scenario as an example: Company ABC wants to adjust the SAG feed based on particle size analysis. By doing so, they need to know when to draw fine material from the stockpile and when to draw coarser material. Calibration allows for the proper “mix” of bulk material in order to optimize the process.
The Swebrec and Rosin-Rammler functions are great for adjusting the distribution curve to accurately compensate for fine material… But what if you are looking strictly at the coarse sizes, say, for oversize detection?
If this is the case, you may want to reconsider the calibration process.
Allow me to explain:
A calibrated system is making certain assumptions about material underneath the top layer and may even bias your coarse material fractions when trying to adjust the distribution curve. So, if you are planning on having a conveyor belt shut down if it detects material over x size, you may want to reconsider taking the chance of biasing your results. Instead, an uncalibrated system is going to get you very useful data that will allow you to stop/start/act on out-of-spec readings and optimize your process.
What are other reasons why clients don’t calibrate?
Lorsque le matériel est trop volumineux, il est beaucoup plus difficile d'échantillonner manuellement le matériel, et cela pourrait être coûteux. Ce problème se pose le plus souvent du côté du sablage de l'application, où l'optimisation du sablage repose fortement sur la détection des changements relatifs de la taille du matériau.
Pour l'analyse post-broyage, certains clients détectent l'usure du revêtement par des augmentations relatives de la taille du matériau, rendant ainsi l'étalonnage inutile.
En résumé, l'étalonnage a certainement son utilité dans les industries minières et des agrégats, et plus précisément, lorsque des tailles de matériaux plus fines sont une partie nécessaire du dilemme ; cependant, les systèmes non calibrés sont toujours très utiles pour optimiser votre processus et pour suivre les changements relatifs.


What is WipWare’s warranty policy?

WipWare Inc. provides a one-year limited warranty on all products, including components and software. To offer customers peace of mind, WipWare also offers an annual service contract, which includes exclusive technician service rates, monthly check-ins, extended system warranties, and more.
With the purchase of any WipWare photoanalysis product, the warranty covers cross-shipping for any defective product under the WipWare Limited Warranty, ensuring minimal downtime for customers.
Pour plus de détails sur la garantie limitée WipWare, consultez ici.


Comment WipWare facilite-t-il la formation pour ses produits uniques ?

WipWare goes above and beyond to ensure that not only customers, but any individual or company who may show interest in a WipWare product has the utmost training and confidence when it comes to utilizing our extensive line of photoanalysis systems. WipWare offers free training to individuals, companies, colleges, and universities interested in learning about our products. We recently conducted on-campus workshops for mining students at Queen’s University (Kingston), Laurentian University (Sudbury), and ÉTS University (Montreal). In addition to in-person sessions, we provide virtual training and have a library of training videos available for easy access.Mining students in photo learning WipFrag
For more information about WipWare training please contact support@wipware.com

For more information about our systems, please visit our YouTube channel.

WipFrag

WipFrag 4 FAQ!

We’ve put together some FAQs for WipFrag 4 image acquisition based on questions from our customers.

J'ai acheté le logiciel WipFrag et j'ai quelques questions sur la bonne acquisition de photographies à utiliser avec ce logiciel ?

For accurate fragmentation analysis with WipFrag, follow these key guidelines when capturing images:
Proper Scaling – Use a scale object (e.g., a known-sized object) in each image to ensure accurate measurements unless using auto-scaling.
Good Lighting – Avoid shadows and overexposed areas to maintain clear rock particle visibility.
Correct Angle & Distance –Stand at any distance where the biggest particle occupies 20% of the image.
Sufficient Coverage – Capture multiple images to represent the entire fragmentation distribution, avoiding overly distant shots. WipFrag has the merging feature to help combine all the images in a single result.
High Resolution – Use a good-quality camera to ensure sharp images with clear particle edges.
The expert photographers and software designers here at WipWare have put together a helpful and insightful document correctively named “The Sampling and Analysis Guide”.
This document is available in the Products and Services section of the WipWare website (download here: https://wipware.com/wp-content/uploads/2021/06/Sampling-and-Analysis-Guide-2021.pdf)


Quel est le meilleur moment pour prendre des photos de matériel extérieur ?

Avoid capturing images early in the morning or late in the evening, as the low sun creates long shadows around particles, particularly oversized ones. This can make it difficult to identify an EDP and increase manual editing time.
For optimal results, take images late in the morning or early in the afternoon, especially on overcast days. The even lighting during these times produces soft, uniform shadows, making EDP detection easier and significantly reducing the need for manual adjustments.


What is False positive in Image analysis?

A false positive occurs when your analysis contains either a fusion or disintegration error. A fusion error happens when two or more particles are mistakenly merged into one, while a disintegration error occurs when a single particle is incorrectly fragmented into multiple pieces.


What is the recommended way to manually edit analysis on WipFrag?

We recommend that you first use the deep learning EDP.
To improve the particle delineation, activate the edit assist tool, to show you the 50 biggest particles.
1. Lorsque vous trouvez des erreurs de désintégration, vous avez deux options :
a. Use the ‘Lasso Delete & Outline’ tool (Tool No. 5) to trace around the entire particle. This tool will delete any net within the shape you drew and will draw net along the line you traced.
b. Use the ‘Block Delete’ tool to quickly delete unnecessary net without deleting the net that is correctly surrounding the particle. This can usually be faster than tracing the entire particle using ‘Lasso Delete & Outline’.
Rocks showing edge detection
c. When you find a fusion error, use the ‘Free Draw’ tool to draw a line along missing edges.
Simply repeat the above until satisfied.


Comment WipWare facilite-t-il la formation pour ses produits uniques ?

WipWare goes above and beyond to ensure that not only customers, but any individual or company who may show interest in a WipWare product has the utmost training and confidence when it comes to utilizing our extensive line of photoanalysis systems. WipWare offers free training to individuals, companies, colleges, and universities interested in learning about our products. We recently conducted on-campus workshops for mining students at Queen’s University (Kingston), Laurentian University (Sudbury), and ÉTS University (Montreal). In addition to in-person sessions, we provide virtual training and have a library of training videos available for easy access.Mining students in photo learning WipFrag
For more information about WipWare training please contact support@wipware.com


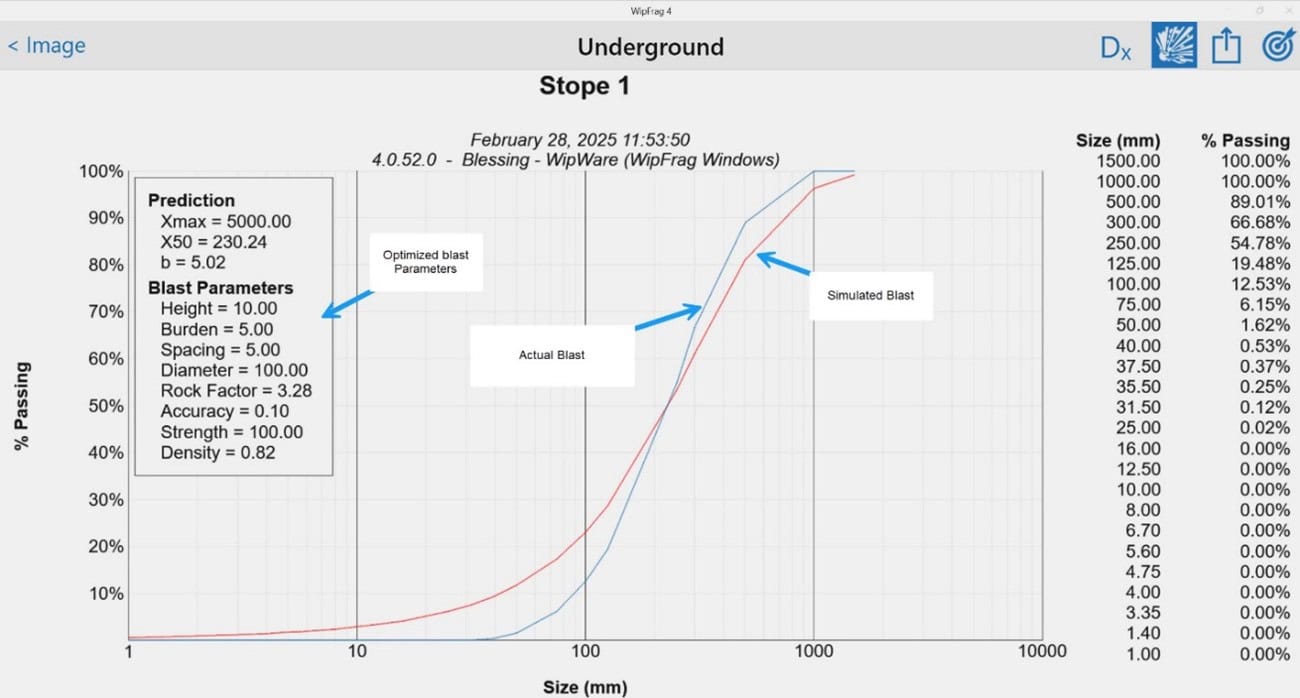
Can WipFrag 4 be used for simple Drill and Blast simulation?

Yes. WipFrag 4 has a module called BlastCast using KCO model for simulation of blast parameters. This model used both controllable and uncontrollable parameters to predict PSD.

The easiest way to obtain particle size distribution data from a photograph is to download WipFrag 4 on your mobile device. Simply open the app, capture an image of the material, analyze it using WipFrag’s advanced processing tools, and receive accurate size distribution results within minutes.


How can I analysis large blasting with WipFrag 4?

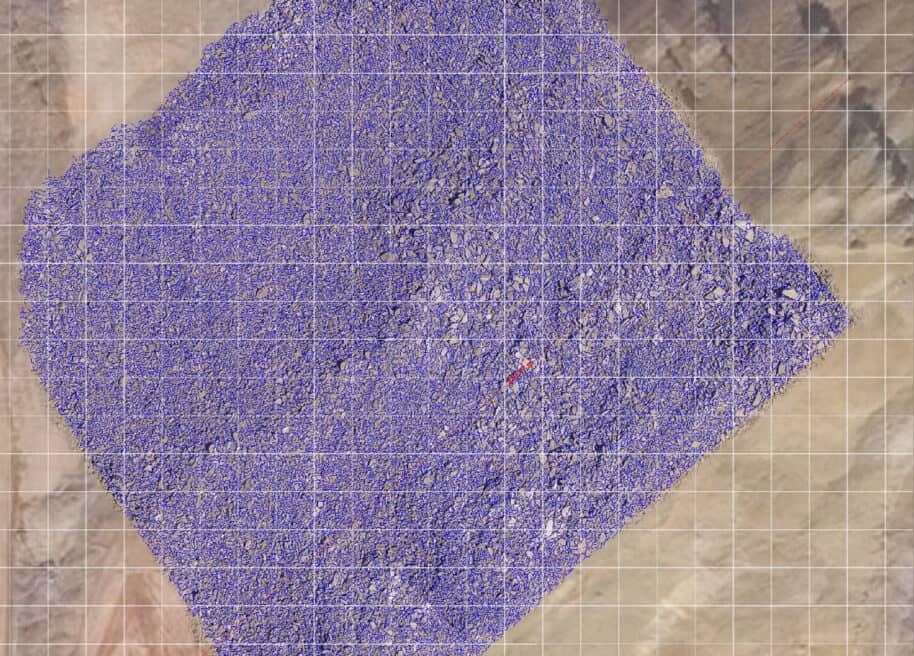
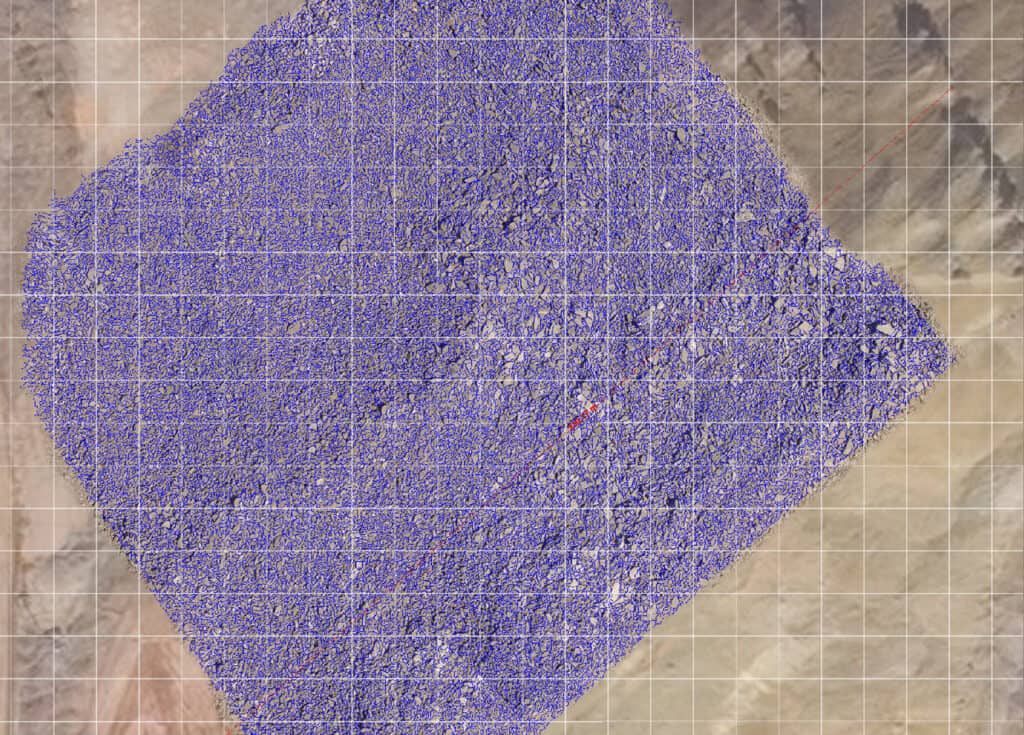
There are two methods for analyzing large blasts using WipFrag 4. The first method involves using drone images, where the software generates an orthomosaic from UAV-captured images. orthomosaic image of blasted rock with generated blue net around the particles
The second method allows you to capture multiple images and merge them within WipFrag 4, providing an average result across all images for a comprehensive analysis.


Can I compare multiple blast results on WipFrag 4?

Yes, select all blast images in the WipFrag workspace, click the three dots in the upper corner, and choose “Merge and View Chart” to display the PSD. The software will present all blast PSDs on a single chart for easy comparison.

For more information about WipFrag, please visit our YouTube channel. Tutorial videos are available on a variety of WipFrag topics.

WipFrag

WipFrag 4 prend en charge les images de drones

WipFrag 4 permet désormais à nos utilisateurs de choisir entre un logiciel tiers ou des images de drones uniques pour créer des images orthomosaïques GeoTIFF à analyser.

Pour créer votre propre orthomosaïque dans le logiciel, nous avons intégré la fonction ODM (Open Drone Map). Avec cette nouvelle fonctionnalité, vous pouvez prendre des images de drones uniques qui ne nécessitent pas de logiciel tiers coûteux et créer votre propre fichier GeoTIFF.

Si vous avez déjà un logiciel tiers et que vous souhaitez créer une image orthomosaïque GeoTIFF à télécharger dans WipFrag 4, prenez simplement des images à l'aide d'un drone et d'un logiciel de trajectoire de vol tiers créant une image orthomosaïque GeoTIFF.

Avec WipFrag, nous recommandons des produits DJI spécifiques et des logiciels de trajectoire de vol tels que Drone Deploy ou Pix4D. L'utilisation de produits logiciels de trajectoire de vol avec un drone vous permettra de générer des profils 3D, des volumes de stock, une cartographie thermique d'altitude et nos images orthomosaïques GeoTIFF préférées.

Lorsque vous choisissez un drone, voici quelques spécifications et recommandations de caméras.

  • Appareil photo de bonne qualité (> 6 mégapixels d'images fixes)
  • Bon temps de vol (>25 minutes convient à la plupart des applications)
  • Gimbal capable de vue vers le bas (perpendiculaire au sol)
  • Capable de l'interface iOS pour la planification de mission et le vol autonomes
  • Bonne vitesse de vol (> 40 mph/65 km/h nécessaire pour la résistance au vent)
  • Bonne plage de fonctionnement (> 4 mi/6,4 km aide dans l'environnement de la fosse)
  • Évitement automatique des collisions et capacité de retour à la maison
  • Pièces/accessoires abordables et faciles à trouver
  • GPS & GLONASS

WipFrag prend les images de drones orthomosaïques GeoTIFF et crée des mesures détaillées de fragmentation de l'explosion. Le logiciel du drone assemble les images et crée une image haute résolution plus grande. Le logiciel du drone aligne les photographies pour maintenir l'échelle et créer une représentation exacte de la surface de la Terre.

Les images orthomosaïques de drones n'ont pas besoin d'une référence d'échelle sur la pile de dynamitage car l'image orthomosaïque GeoTIFF contient la référence d'échelle et le logiciel WipFrag 4 Windows a des capacités améliorées pour gérer ces grands ensembles de données.

WipFrag 4 vous donne également la possibilité d'utiliser notre Service MailFrag qui prend également en charge les images orthomosaïques GeoTIFF. La soumission d'images UAV est la même que la soumission d'images MailFrag standard. Une analyse d'image UAV coûte 9 crédits d'analyse d'image.

Veuillez visiter notre site Internet pour plus d'informations sur WipFrag 4 et notre MailFrag service d'analyse d'images en ligne.

Nous sommes heureux de fournir une assistance supplémentaire et des recommandations détaillées. N'hésitez pas à nous envoyer un email à support@wipware.com. Des sessions de formation à distance sont également disponibles.

For a tutorial on how this new ODM feature works, click ici

WipFrag

WipFrag pour Android

WipFrag Android

WipWare est ravi d'annoncer que nous avons publié WipFrag pour Android. Désormais, nos clients peuvent faire l'expérience du logiciel d'analyse de fragmentation WipFrag sur leurs appareils Android. Le nouveau WipFrag pour Android comprend notre fonction de mise à l'échelle automatique qui élimine le besoin d'une échelle de référence.

WipFrag Android

Tous les nouveaux abonnés recevront le premier mois GRATUIT !!!

Offre valable jusqu'au 30 juin

Nos produits WipFrag permettent une analyse PSD instantanée des images numériques. Ces images peuvent être collectées sur le tas de fumier après une explosion, un échantillon plus rapproché d'un stock, un échantillon de laboratoire ou même des images de drone / UAV.

WipFrag 3 permet aux utilisateurs de capturer la fragmentation de la pile explosive à l'aide d'images iOS, DSLR et UAV. Avec des capacités de mise à l'échelle automatique sur iOS et Android, WipFrag 3 est l'outil d'analyse de fragmentation sûr, rentable et le plus précis au monde.

En plus de fournir la taille des particules et la distribution de forme, la dernière version de WipFrag est capable de détecter deux types d'irrégularité / contamination / dilution en fonction de la couleur du matériau.

Autres plates-formes disponibles: WipFrag iOS, WipFrag pour Windows (téléchargement uniquement) et WipFrag pour Windows USB.

fr_FRFR