Company

Company

Evaluating Rock Comminution Pre-Blast to Post-Blast and Through Mineral Processing

High-resolution mining and aggregate processing workflow diagram for WipWare analysis tools.

Statement of the Problem: The Need for Energy Efficiency Assessment in Blasting

In today’s mining and quarrying operations, energy efficiency remains one of the most pressing challenges. Blasting, being the first step in the comminution process, consumes a significant portion of total energy in mineral production. Yet, the true measure of blasting efficiency is not merely how rock is broken, but how well the resulting fragmentation supports downstream processes such as crushing and grinding.

A tool is therefore needed to assess and quantify the energy utilization in blasting, specifically through fragmentation analysis. By analyzing fragmented rock sizes in terms of percentage passing, engineers can evaluate how effectively a particular blast design converted explosive energy into rock breakage. Since controllable parameters such as burden, spacing, charge distribution, and initiation timing govern how explosive energy is distributed within the rock mass, understanding fragmentation helps determine how these parameters interact with uncontrollable factors like rock structure and discontinuities.

WipWare: The Global Ruler for Rock Size Assessment

WipWare Inc. is well known as the world leader in rock size measurement and fragmentation analysis. Known as the ruler for rock size assessment, WipWare provides innovative tools that quantify particle size distributions (PSD) from pre-blast through post-blast and into mineral processing stages, creating a continuous feedback loop for process optimization.

Dynamic mineral processing workflow illustrating WipWare's role in fragmentation analysis, from mining to mill output.

Pre-Blast Assessment with WipJoint

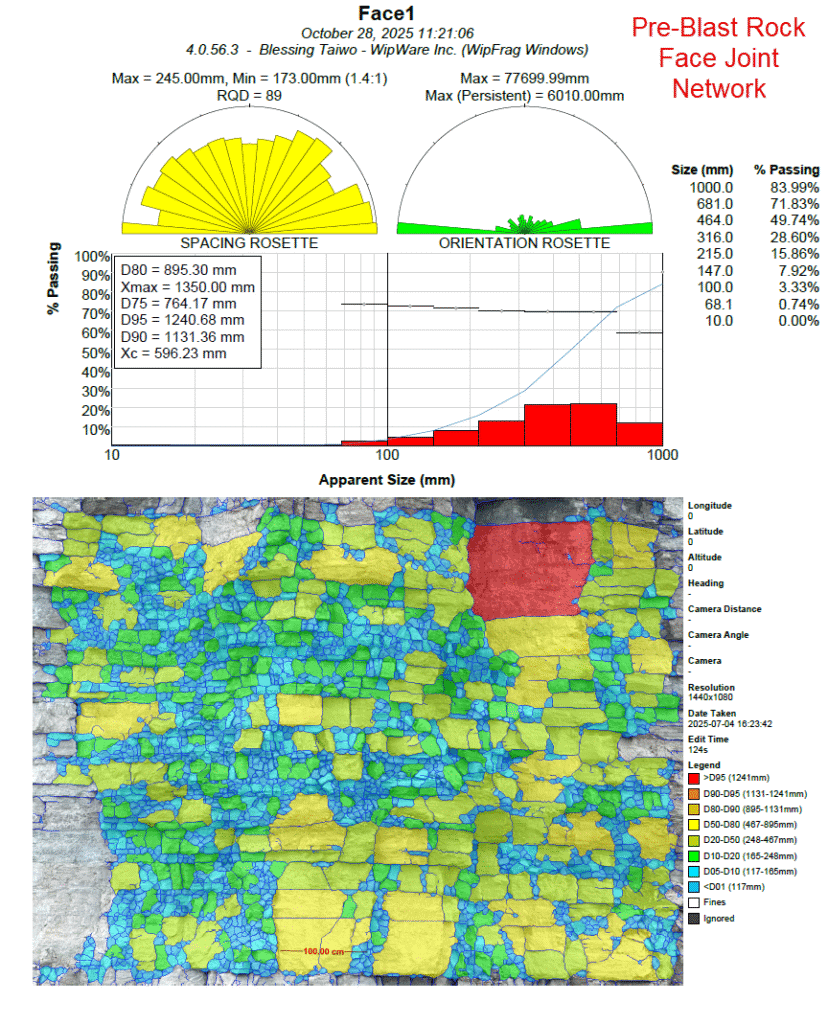
Understanding the geological conditions before blasting is crucial for predicting fragmentation outcomes. To bridge the gap between rock mass discontinuity and fragmentation potential, WipWare re-introduced WipJoint, a technology developed in 1990 by Dr. Norbert Maerz, Dr. John Franklin, and Dr. Tom Palangio.

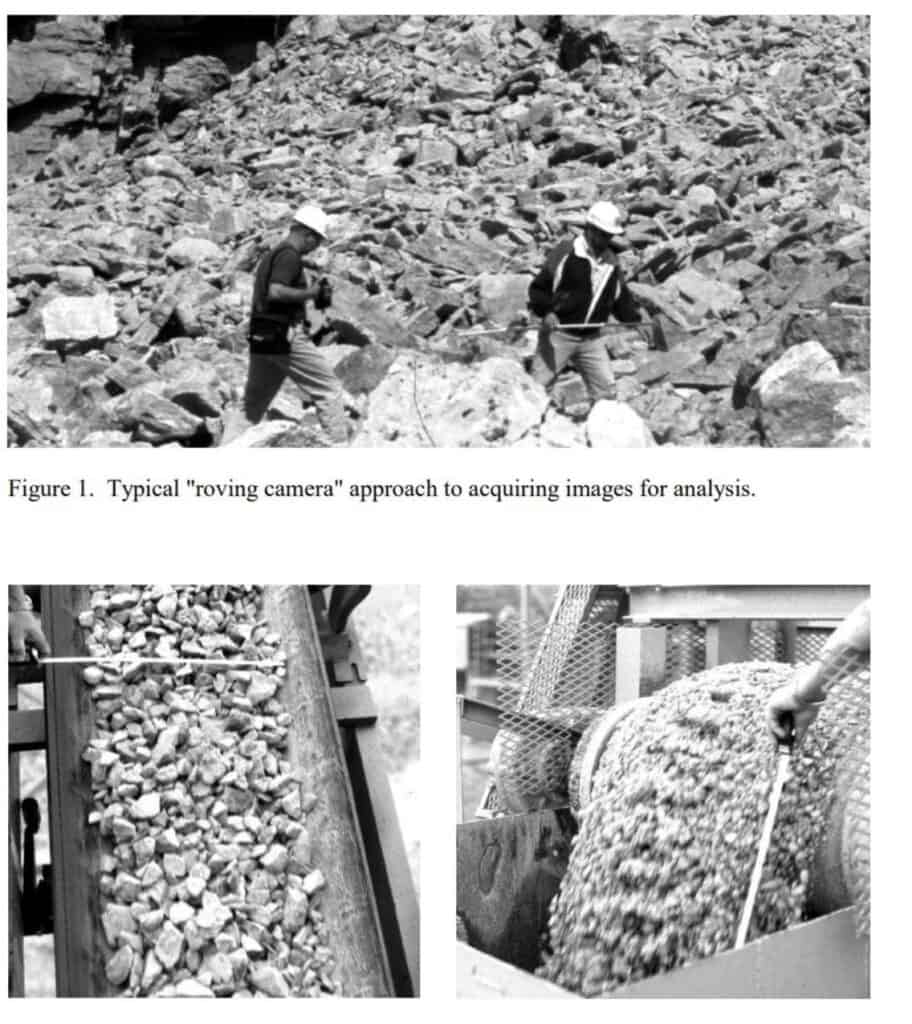
WipJoint enables users to assess rock joint apparent spacing, apparent orientation, RQD and apparent in-situ block size from digital images of rock faces. This pre-blast information is invaluable for correlating structural conditions with post-blast fragmentation results. By analyzing joint characteristics, mining engineers can refine their blast design to ensure optimal energy distribution within the rock mass, thereby improving fragmentation and reducing energy waste in subsequent comminution stages.

Pre blast rock face joint network analysis

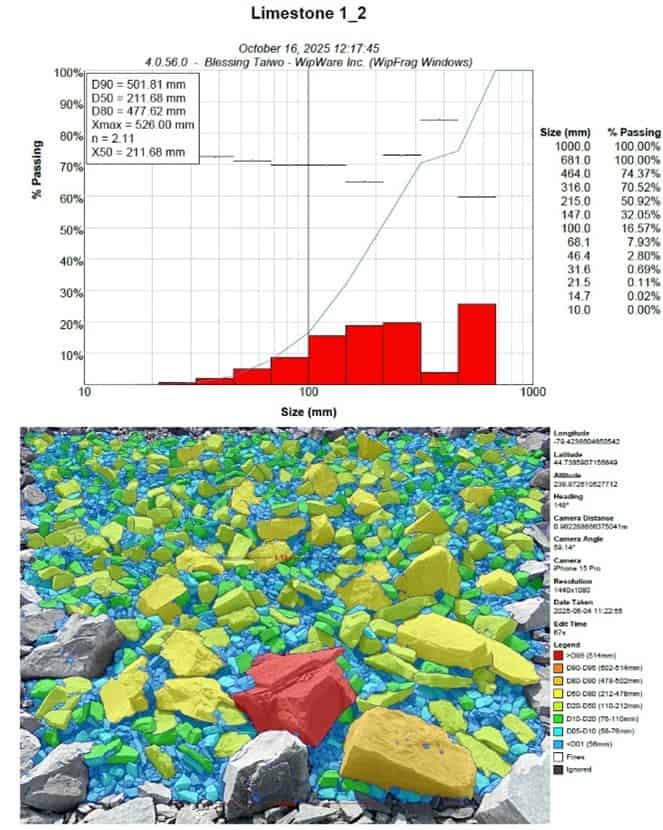
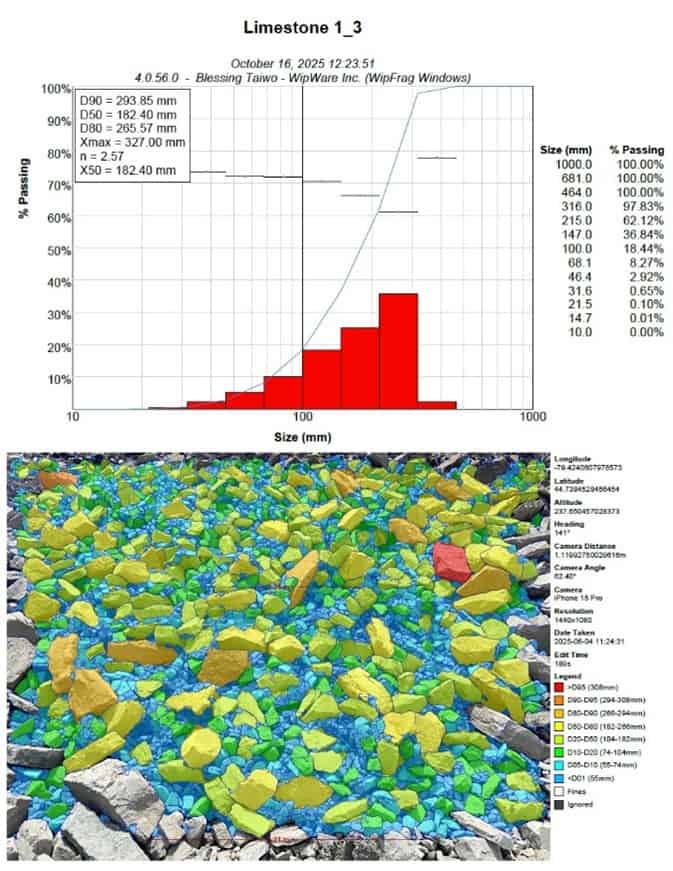
Post-Blast Fragmentation Analysis with WipFrag

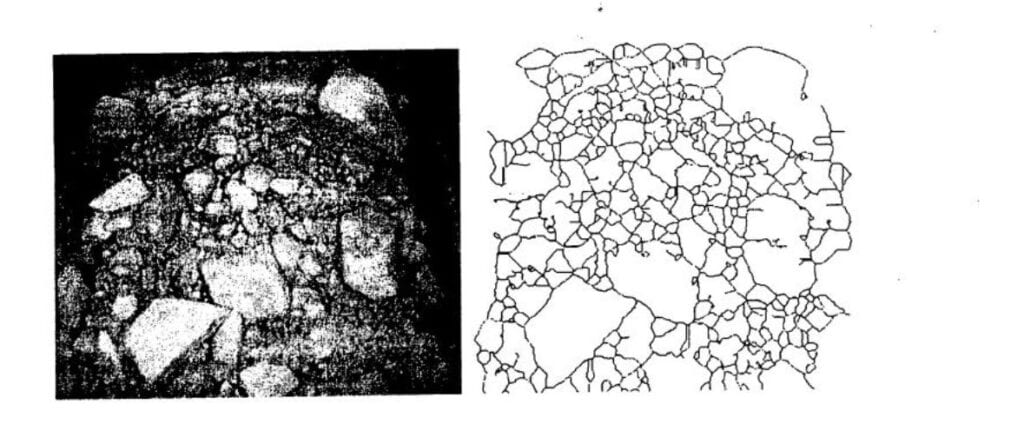
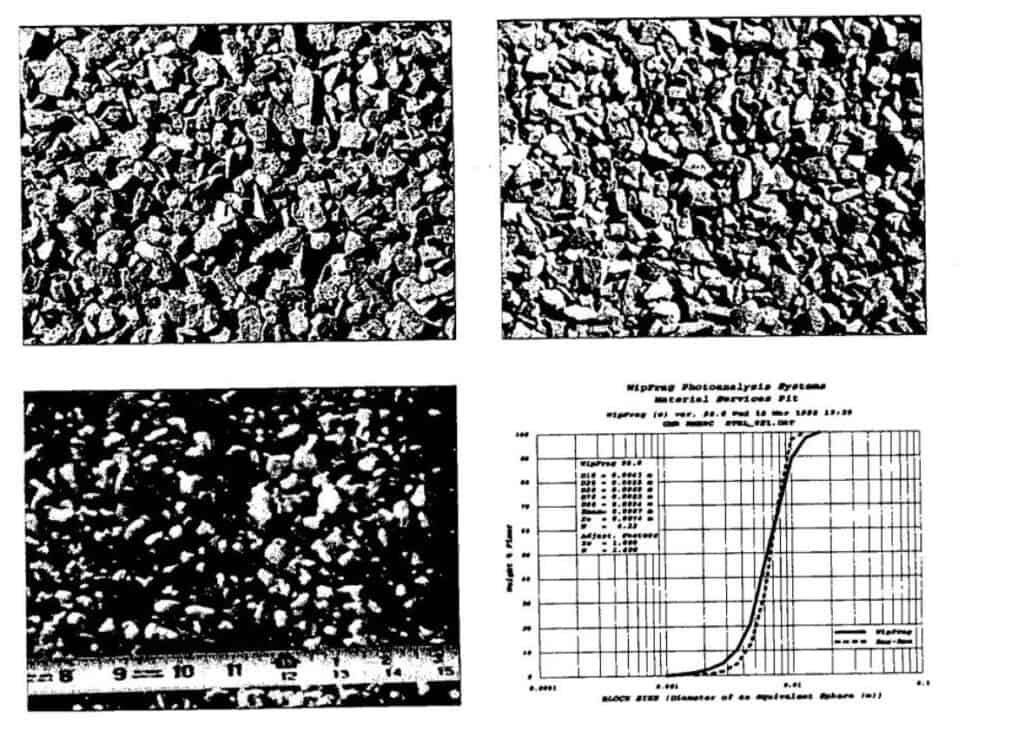
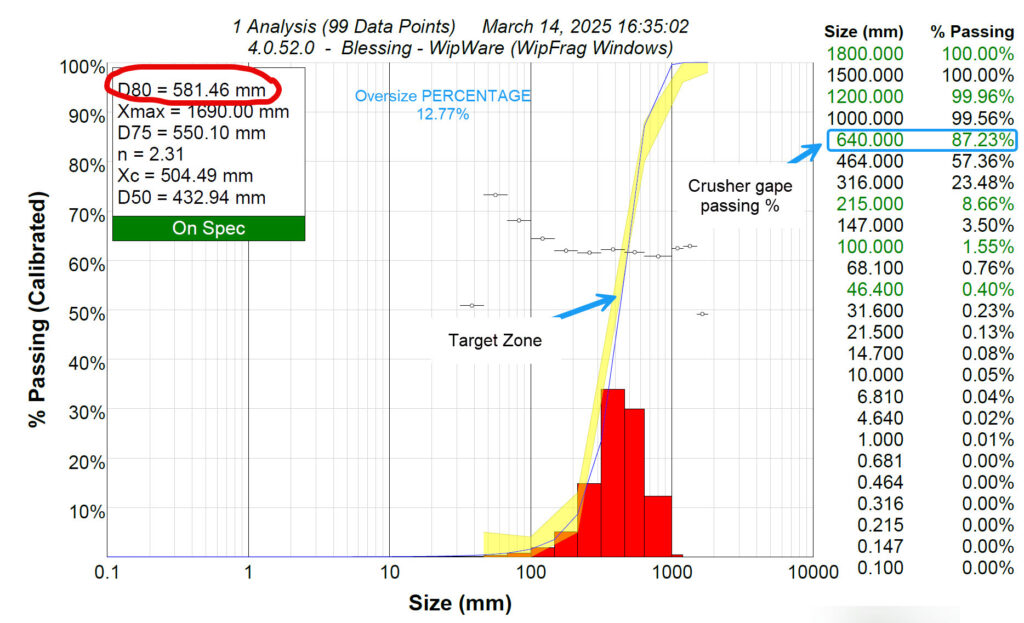
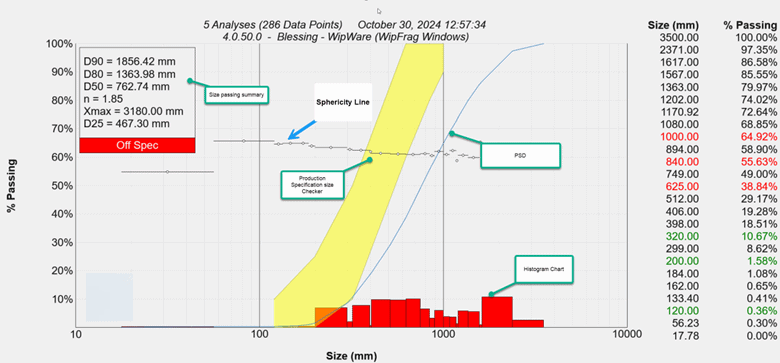
Once blasting is completed, WipFrag provides the most reliable and efficient means for evaluating fragmentation results. Using advanced image analysis, WipFrag calculates the particle size distribution (PSD) of fragmented rock piles and compares the results to target sizes such as the primary crusher’s gape.

This capability allows for quantitative comparison between different blast designs, helping to identify which parameters yield the best fragmentation for energy efficiency and crusher compatibility. With tools like specification envelopes and boulder detection, WipFrag makes it possible to assess whether the blast produced the desired material size and shape for downstream processes.

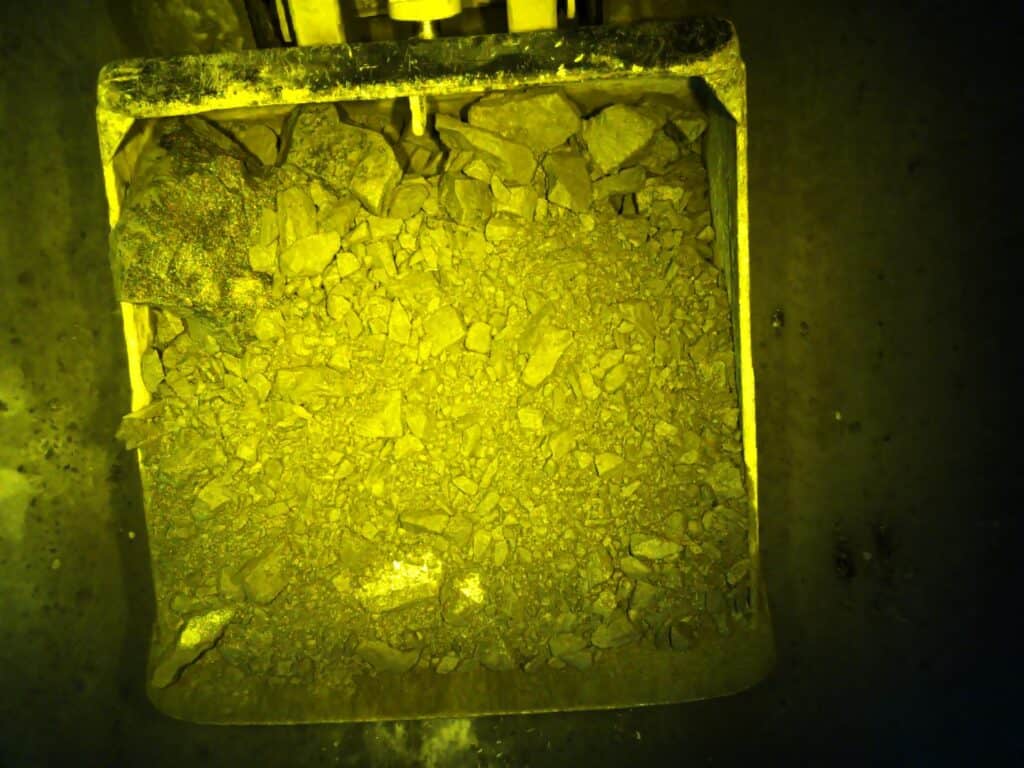
Material Assessment During Haulage with Reflex 6

Fragmentation control doesn’t stop at the muck pile. During haulage, WipWare Reflex 6 extends analysis to every truckload of material. Equipped with high-resolution cameras and an onboard computer, Reflex 6 captures real-time images of material in transit, either while loaded on the truck or when being dumped at the crusher hopper or stockpile.

This technology enables continuous monitoring of material quality from each blast bench, providing operators with valuable data on fragmentation size, shape, uniformity and ore type variation. The Reflex 6 system thus acts as vehicle load assessment platform, ensuring that no load goes unanalyzed.

Rocks in a dump truck

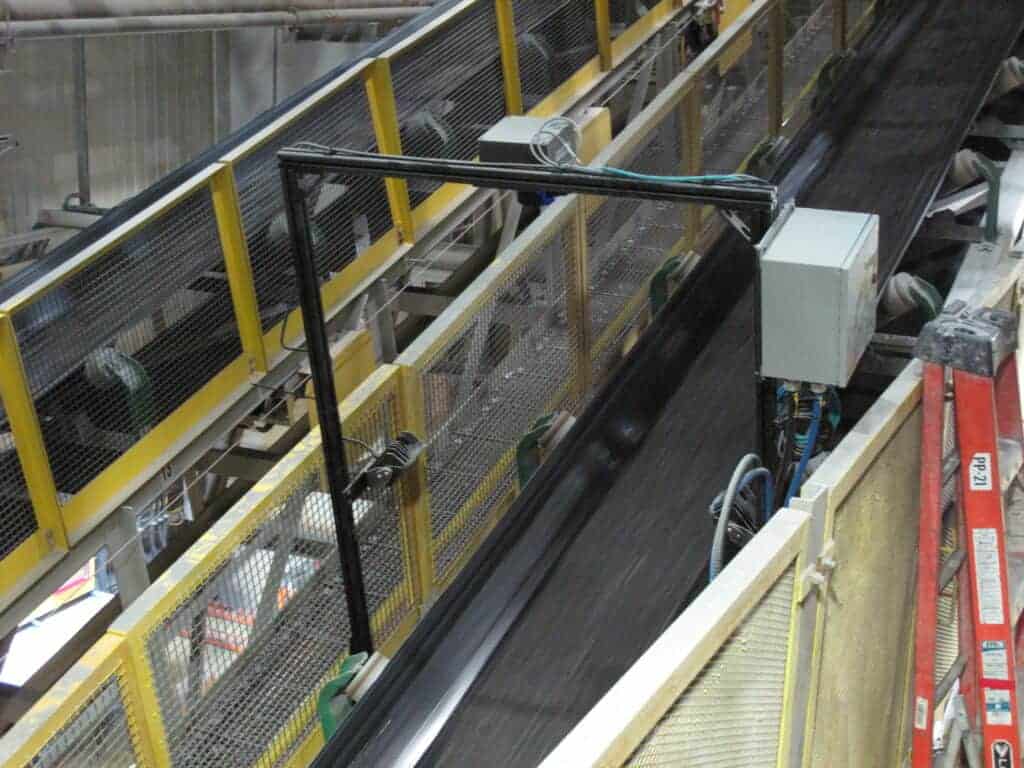
Conveyor Belt Monitoring and Process Optimization with Solo 6

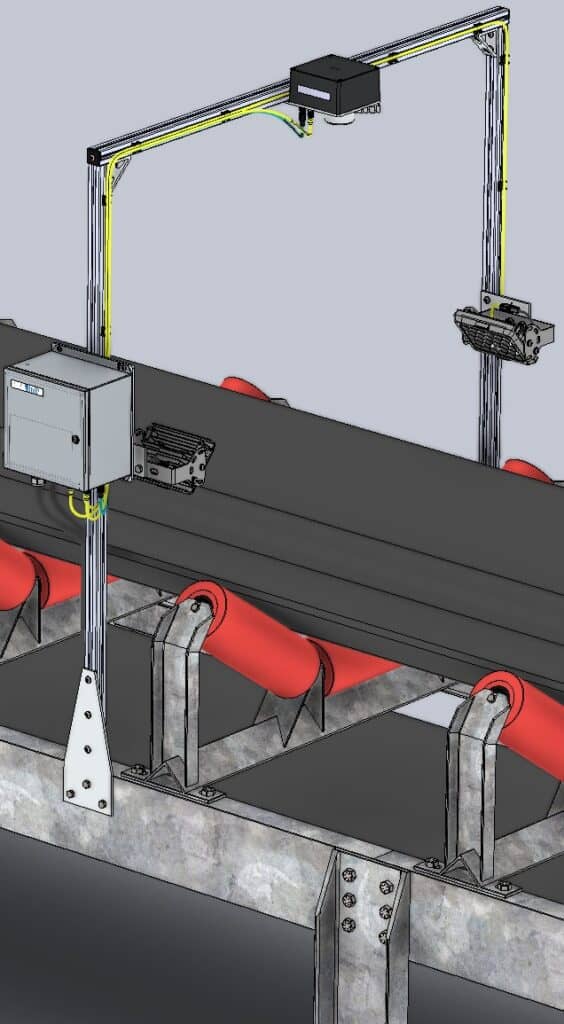
At the mineral processing stage, WipWare Solo 6 revolutionizes comminution monitoring. Installed over conveyor belts, Solo 6 continuously analyzes the size distribution of material feeding the crusher or exiting as product. This intelligent system provides live feedback to operators, empowering them to make real-time decisions for process optimization.

Solo 6 integrates seamlessly with existing process control systems such as Modbus TCP and OPC UA, allowing direct communication with plant control networks. This enables automatic crusher gap adjustment, SAG mill feed control, and load balancing, ensuring that the plant operates within optimal limits.

By maintaining consistent feed size and adjusting operational parameters accordingly, Solo 6 helps minimize bearing pressure, reduce liner wear, improve throughput, and enhance overall energy efficiency throughout the comminution circuit.

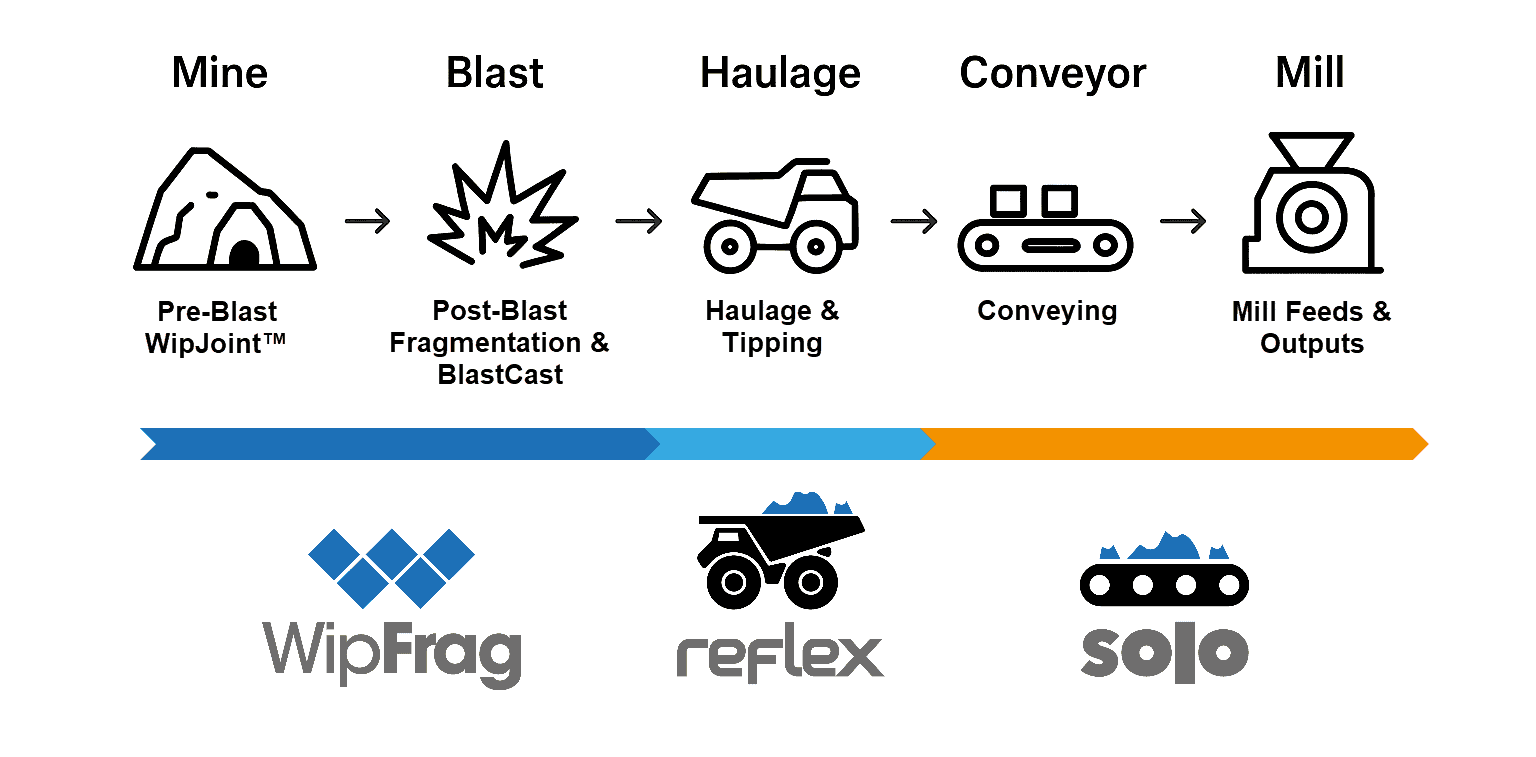
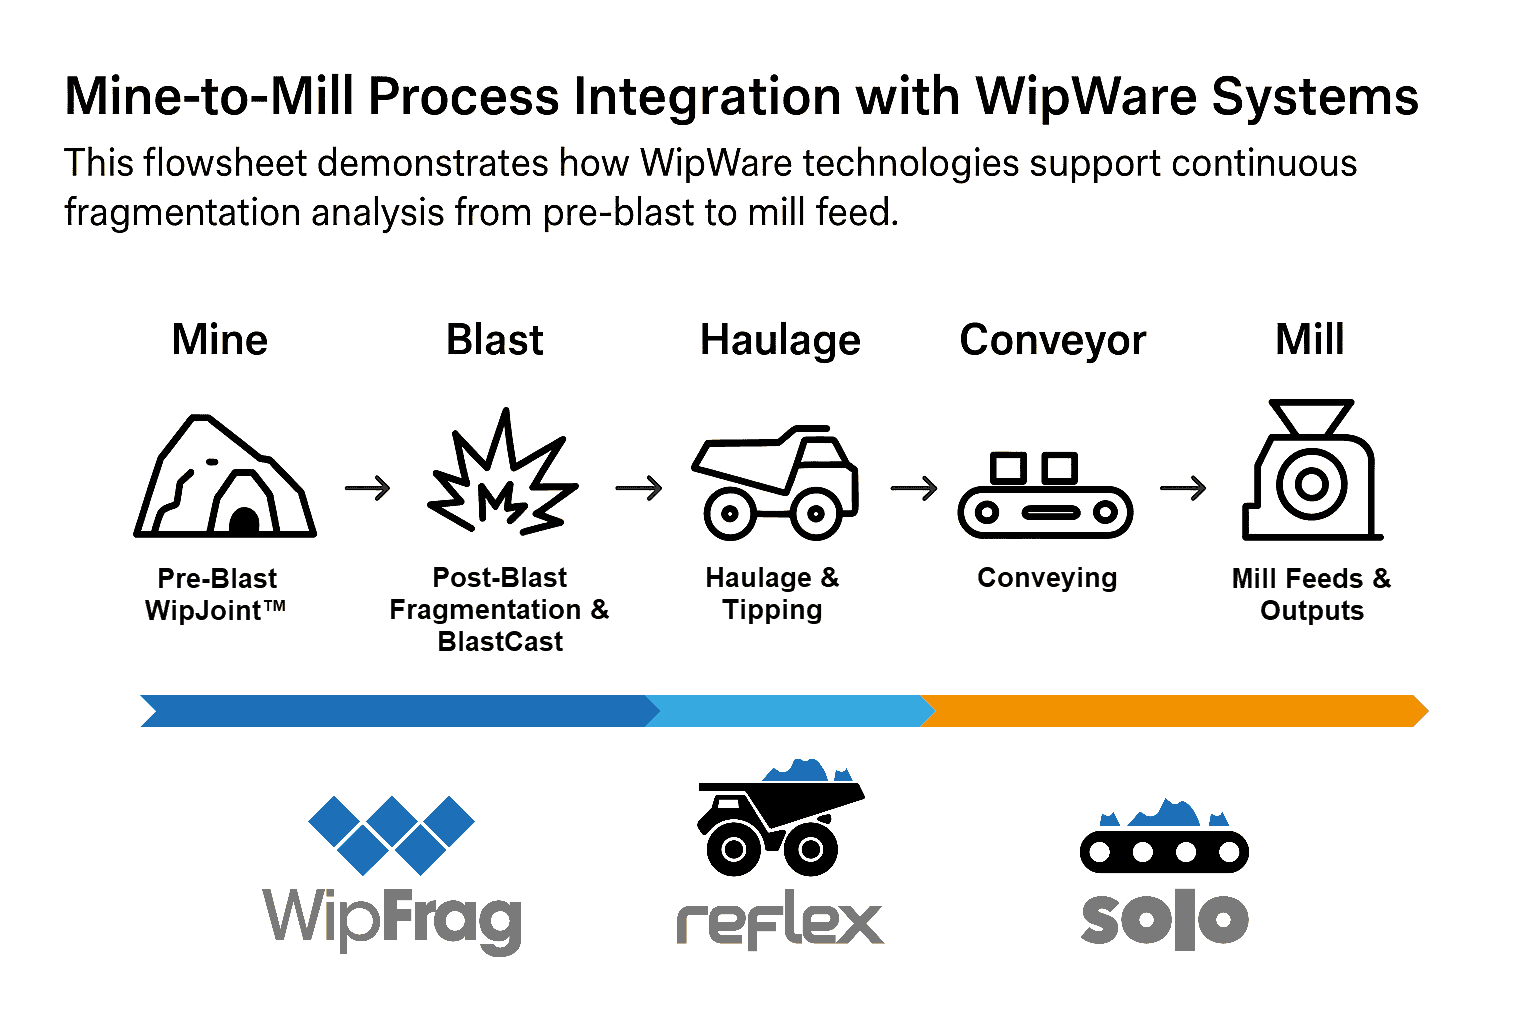
WipWare technology provides a fully integrated suite of solutions that cover every stage of the comminution chain, from pre-blast geological assessment (WipJoint), through post-blast fragmentation evaluation (WipFrag), haulage assessment (Reflex 6), and processing control (Solo 6). By quantifying and connecting each step, WipWare enables mines to measure, monitor, and optimize energy use across the entire operation. The result is smarter blasting, improved crusher efficiency, and a more sustainable approach to mineral processing, achieving the ultimate goal of energy-efficient comminution.

Image of WipWare Solo system over a conveyor belt

Mine-to-Crusher Application of WipWare Solutions: Case Study at dstgroup Quarry

This study presents the third phase of a three-part research series focused on optimizing the interface between blasting and primary crushing operations at dstgroup aggregate quarry in Portugal, using WipWare solutions. The central goal is to improve fragmentation outcomes to better align particle size distribution (PSD) with crusher requirements, thereby reducing energy consumption and enhancing operational efficiency.

Building on the baseline methodology developed in Part 1, which incorporated 3D bench modeling and borehole surveys to assess blast compatibility with crusher specifications, the study identified discrepancies between predicted and actual fragmentation results. Part 2 applied targeted adjustments, such as reducing subdrill depth and altering stemming material, achieving measurable improvements in D80, maximum fragment size, and overall blast efficiency. However, boulder formation persisted in certain blast rows, prompting further optimization.

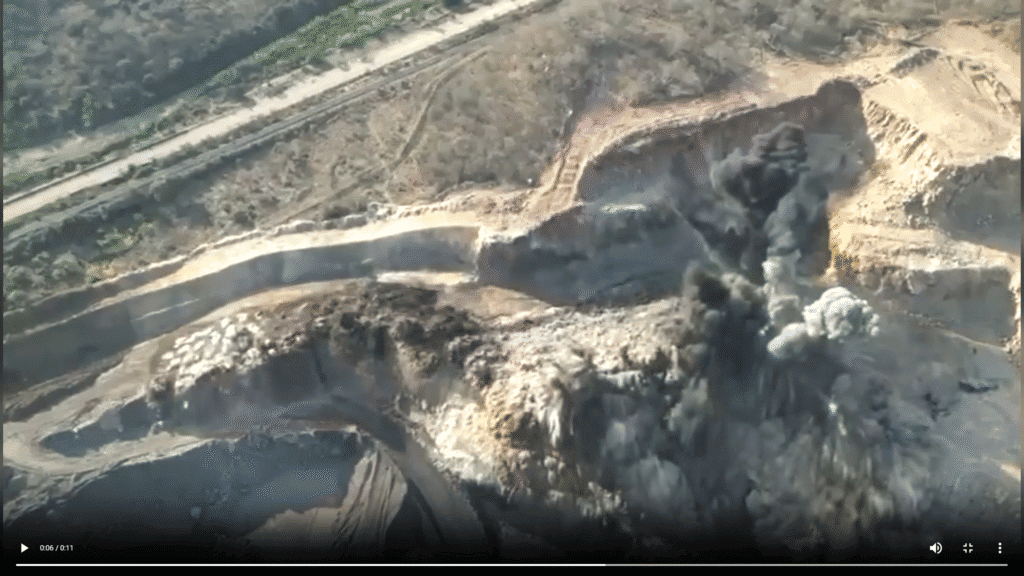
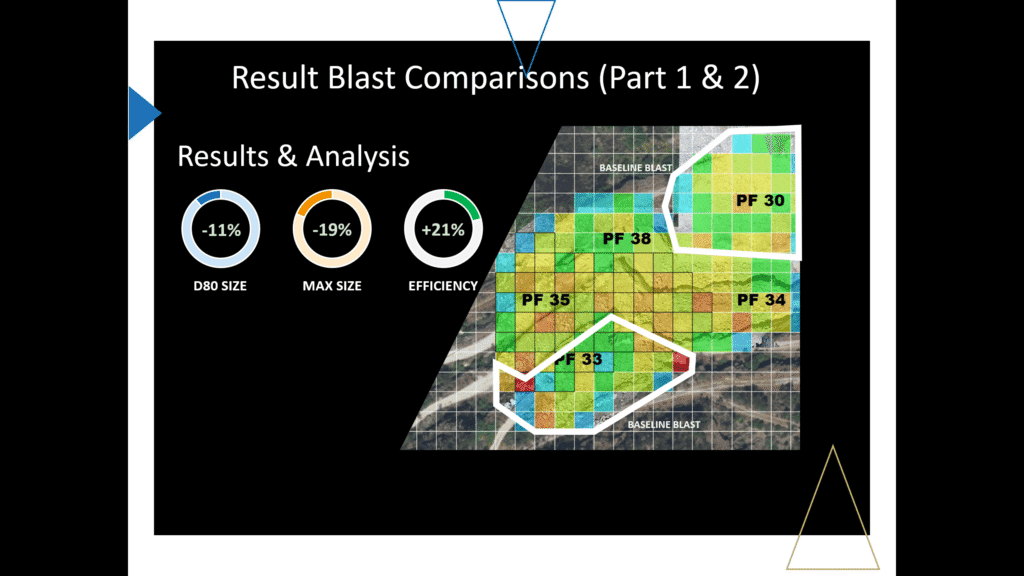
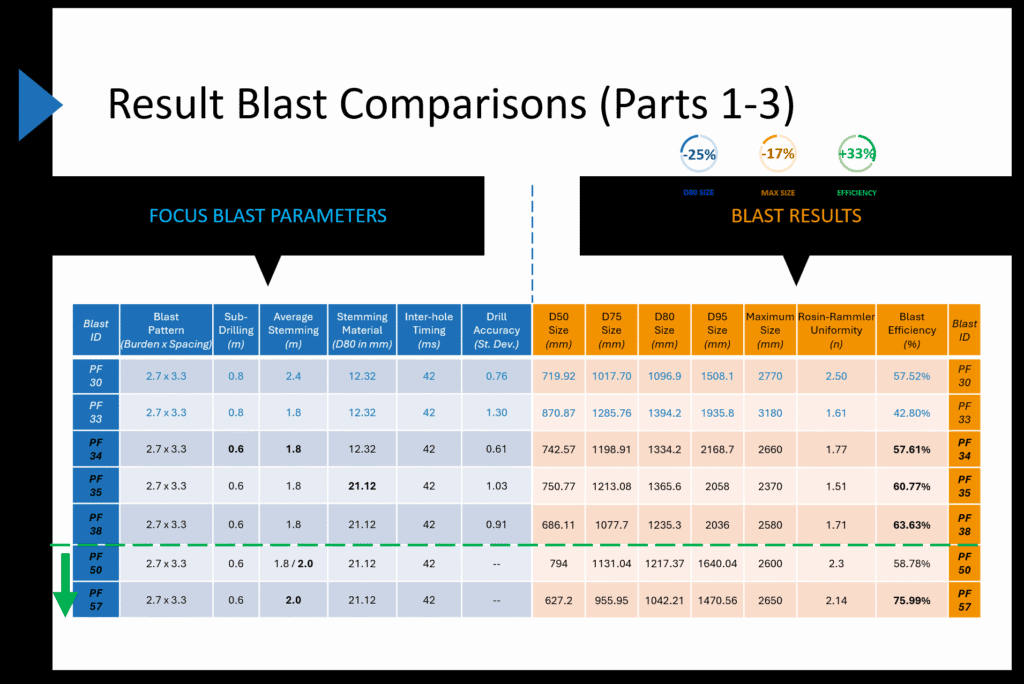
In this phase, the team implemented remaining recommendations, including refined drill and blast patterns, increased stemming size (from D80 12 mm to 21 mm) and length (from 1.8 m to 2 m), improved drilling accuracy, and adjusted inter-hole timing. High-resolution drone imagery and point-by-point blast surveys were integrated into O-PitSurface simulations to evaluate blast performance. WipFrag software was utilized for detailed particle size analysis, enabling comparison of fragmentation outcomes before and after design modifications.

Results demonstrated significant gains: D50 decreased by 19%, D80 and D95 by 20% and 23%, respectively, and maximum particle size reduced by 3%, indicating better control over oversized material. Fragmentation efficiency improved by over 21%, and the uniformity index increased by 16%, reflecting more consistent and predictable PSD. Adjustments to stemming material and length enhanced energy confinement, minimizing premature blowout and promoting even energy distribution throughout the blast column.

Run-of-mine monitoring with the Reflex 6 system above the primary crusher provided real-time PSD analysis, confirming continuous improvement in fragmentation and crusher feed consistency. Over a six-month period, key size distribution metrics consistently trended downward, validating the effectiveness of iterative blast parameter adjustments and demonstrating the value of data-driven, integrated mine-to-crusher strategies.

In conclusion, the study illustrates how WipWare solutions, including WipFrag, Reflex 6, and O-PitSurface, enable quarry operations to optimize fragmentation, reduce oversize and fines, improve crusher compatibility, and enhance overall operational efficiency. The mine-to-crusher framework serves as a replicable model for energy-efficient, predictable, and high-performance blast-to-crusher integration.

Results and analysis from a blast. Circles showing percentage and heat map
Result Blast comparison with focus blast parameters in blue and blast results in orange

Read Full paper here: Mine to Crusher Framework for Quarries

Company

Literature Review: Application of WipWare Technology

Blast on a bench face

WipWare’s fragmentation analysis technologies have been widely applied across various mining operations to solve critical challenges. These were associated with material flow, fragmentation consistency, energy use, and overall process efficiency. I came across Tom Palangio‘s works on numerous case studies highlighting the effectiveness of WipWare‘s tools. These tools optimized blasting practices and downstream processing. This review presents a summary of several influential studies and industrial applications of WipWare technology.

Photographic Fragmentation Analysis

Selbaie Mine, Joutel, Quebec, Canada

In the mid-1990s, Selbaie Mine utilized photographic fragmentation analysis using WipFrag to assess explosive performance and optimize blasting patterns. The integration of WipWare technology enabled the mine to monitor and control several key performance indicators. Some of these indicators included energy consumption for crushing, loading rates, haul truck payloads, secondary blasting costs, and maintenance expenditures. Fragmentation data revealed a more comprehensive understanding of the effects of blast results on overall mining cost structures. This information allowed the mine to better manage ore processing operations. They could quantify the true cost of mineral handling based on fragment size.

Significant Pattern Optimization

INCO Coleman Mine, Sudbury, Ontario, Canada

INCO’s Coleman Mine used WipFrag during a detailed study in 1994, resulting in significant pattern improvement. The original tight blast pattern (5ft x 10ft) yielded a characteristic size (Xc) of 0.617 m, with substantial oversize material requiring re-blasting. Progressive expansion of the blast pattern to 6ft x 10ft and eventually 7ft x 10ft not only improved fragmentation (Xc = 0.318 m) but also reduced oversize entirely. WipFrag data was instrumental in determining optimal fragmentation, with INCO realizing up to 40% blast pattern expansion and 80% cost savings. Additionally, the technology allowed for reductions in fines generation, further streamlining ore handling and improving crusher feed quality.

Correlate Ore Fragmentation and Hardness with Mill Performance

Highland Valley Copper, Logan Lake, British Columbia, Canada

At Highland Valley Copper (HVC), the team used WipWare tools to correlate ore fragmentation and hardness with mill performance. WipWare’s WipFrag software, Reflex vehicle analysis system and Solo conveyor analysis system played a central role in tracking ore size distributions from the pit through to the mill feed. This enabled real-time optimization of crusher and mill settings. The mine’s dispatch system integrated fragmentation data to guide stockpile management and minimize feed segregation. WipFrag analysis revealed that feed consistency across the grinding lines could be improved by adjusting feeder ratios. This capability to quantify fragmentation effects allowed HVC to perform cost benefit analyses and optimize the balance between blast quality and mill throughput.

Detonator Timing Accuracy and Improved Fragmentation using WipFrag

Bartley and Trousselle – Ogdensburg, New York, USA

At Benchmark Materials Quarry, Bartley and Trousselle demonstrated the link between detonator timing accuracy and improved fragmentation using WipFrag. Digital programmable detonators yielded superior blast uniformity and reduced vibration levels. WipWare’s image analysis facilitated the evaluation of blast performance improvements by providing accurate fragmentation size distribution data.

The Effects of Improved Fragmentation on Mechanical Performance and Power Usage in the Crushing Circuit

Lafarge Canada Inc. – Exshaw, Alberta, Canada

Lafarge’s Exshaw operations applied WipFrag to examine the effects of improved fragmentation on mechanical performance and power usage in the crushing circuit. A redesigned blast using 102 mm holes led to more uniform fragmentation. This resulted in a 16% increase in crusher throughput and a 30% reduction in power consumption. WipWare data also informed decisions related to equipment selection (e.g., drill bits) and wall control, leading to improved safety and reduced vibration impacts on neighboring communities.

Cost-Effective and Reliable Fragmentation Assessment Tool

Barkley and Carter – Evaluation of Optical Sizing Methods

Barkley and Carter evaluated WipFrag as both a cost-effective and reliable fragmentation assessment tool. Their work highlighted that previous blast optimization efforts were constrained by the lack of efficient sizing techniques. In contrast, WipFrag enables meaningful decision-making in blast modeling, mining method selection, and economic planning. The study underscored the significance of image-based sampling frequency, particularly in varied muck pile conditions, to derive actionable insights on crusher performance and feed consistency.

Assess Fragmentation and Stemming Uniformity

Chiappetta, Treleaven, and Smith – Panama Canal Expansion

During the expansion of the Panama Canal, WipFrag was employed to assess fragmentation and stemming uniformity in complex geological and logistical conditions. The integration of WipWare into blasting operations enabled engineers to both track blast outcomes and support adaptive design decisions in real time. In a project characterized by not only marine traffic but also saturated zones and tight deadlines, the technology provided essential support in achieving controlled fragmentation and predictable material handling.

Conclusion

These reviewed case studies emphasize WipWare’s critical role in improving the efficiency and economics of mining operations. Through accurate and real time fragmentation analysis, WipWare technologies facilitate optimization across the mine to mill value chain. From reducing energy consumption and equipment wear, to improving blast designs and minimizing fines, WipWare’s technologies offer robust solutions to a range of material flow problems in both surface and underground mining environments. These outcomes underscore the value of fragmentation analysis in modern mining practice, unquestionably supporting data-driven decision making and continuous process improvement.

By Blessing Taiwo

Company

WipWare Proudly Celebrates Over 30 Years of Innovation

From a dusty DOS computer to AI-powered, real-time fragmentation analysis systems… WipWare has been at the forefront of fragmentation analysis for over 30 years of innovation, transforming how the world measures particle size.

The Beginning

From humble beginnings to global impact, we’ve come a long way. This year, we’re celebrating over 30 years of innovation in fragmentation analysis. Along the way, we’re taking a look back at the milestones. These milestones shaped us and the journey of making particle size analysis smarter, faster, and easier than ever.

Before WipWare was WipWare, our founder Tom Palangio was in the field with North Bay DuPont. He was tackling real-world challenges with innovative thinking and a practical mindset.

Below is a photo of Tom from our archives. He was working on a project that would spark the idea for our very first product in fragmentation analysis: WipFrag.

Tom Palangio with a hard hat on standing with cameras by a muckpile of rocks. Mining innovation

Solving a Global Problem

Traditionally, describing blast results in mines and quarries was limited to vague terms like “good,” “fair,” or “poor.” Manual sieving and particle counting were too costly and impractical until a team of passionate pioneers changed the game.

WipFrag was born in 1986 from groundbreaking collaboration between Franklin Geotechnical, DuPont/ETI, and the University of Waterloo. It was the world’s first digital image analysis software for measuring rock fragmentation.

Three images of rocks from a muckpile, one with a measuring tape, 4th image is the particle size distribution curve from first versoion of WipFrag

Leveraging advancements in imaging and computer processing, they created a revolutionary tool. A digital method to analyze muckpile photos or video frames to produce a detailed fragmentation size distribution curve.

The name itself carries the legacy: Waterloo Image Enhancement Process for Fragmentation or “WIEP,” later shortened to just “WipFrag.”

Since then, our journey has been marked by bold ideas, hard-earned field experience, and a commitment to excellence that has brought us to where we are today. Tom Palangio, with his explosive expertise, innovative leadership, and close collaboration with Dr. Norbert Maerz and Dr. John Franklin laid the groundwork for much of what we now take for granted in automated material analysis.

First Trials

Thanks to real-world testing in 1980s-1990s at INCO’s Copper Cliff and Coleman underground operations and Highland Valley Copper in BC, WipFrag proved its worth boosting productivity, reducing oversize, and optimizing blast patterns. Results included a 40% pattern expansion and 10% increase in mill throughput milestones that cemented WipFrag’s value in the mining industry.

We owe this innovation to the visionaries who asked, “What if we could measure fragmentation automatically?” and then made it possible. Hats off to the original developers and researchers whose dedication paved the way for what WipWare is today, 30 years strong and still leading the future of photoanalysis technology.

WipJoint and System 1

In 1990, WipJoint was introduced for measuring in-situ rock apparent block size and joint orientation.

Our journey into real-time automated analysis systems began in 1998, led by Thomas W. Palangio, the founder’s son, as he joined the company and introduced our first hardware systems. System 1 was released in 1998 with one camera for online analysis: a well-received innovation for the mining industry. The very next year, System 2 was rolled out, boasting the capacity to integrate 12 cameras for real-time analysis.

Then another year later in 2000, WipFrag 2 was developed, building on the success of the first WipFrag.

WipWware Team showing very first Solo system

In this 2007 photo, WipWare team members gather around the first Solo system — a major step forward in automated material analysis. Originally built for conveyor belts and later adapted for vehicle loads, this early unit was the seed of what would become today’s Solo 6 and Reflex 6 systems — smarter, faster, and tougher than ever.

Pictured here are two faces still leading WipWare forward today:

  • Thomas Palangio (right), now our Chief Technical Officer and Vice President of Technology
  • Kevin DeVuono (back right), now our Head Programmer

WipFrag 3 joined the arsenal in 2014 with drone and GIS capabilities, serving as HMI for our real-time analysis systems. With WipFrag now in the palm of your hand since 2016, WipWare makes it easier than ever for field personnel to assess blast fragmentation instantly, anywhere, anytime and share it across platforms for end-to-end mine-to-mill optimization.

WipFrag Goes Mobile

In 2016, WipWare brought WipFrag to mobile devices — putting fragmentation analysis directly into the hands of field personnel.

For the first time, users could capture and process muckpile images using the camera on their phone or tablet, with the option to sync and share results across devices for further analysis.
This leap in accessibility made data collection faster, easier, and more flexible — using tools people already carried with them.
Designed for the real world — and it redefined the standard.

Pit to Plant Fragmentation Analysis

In 2018 Tom Palangio, President of WipWare enjoyed an interview with The Crownsmen Partners at the CIM in Vancouver. During this interview, Tom discussed how innovation, being a disruptor in the early years and providing excellent leadership has shaped WipWare into the company it is today.

WipFrag 4 Released in 2020

In 2020, WipFrag became easier than ever for field personnel to assess blast fragmentation instantly, anywhere, anytime and share it across platforms for end-to-end mine-to-mill optimization.

WipFrag iOS user at muckpile

Fast forward to today, under the technical direction of Thomas Palangio (CTO), the company continues to redefine industry standards. His creativity, technical drive, and future-forward thinking have powered the evolution of Solo, Reflex, and WipFrag, now enhanced with Deep Learning Edge Detection for unparalleled accuracy across all environments.

From a garage in Bonfield, to a global leader in real-time fragmentation analysis – 30 years of innovation and engineering smarter solutions for the world’s toughest industries.

Since 1995, we’ve been shaping the future of mining technology with groundbreaking tools like WipFrag, Solo, and Reflex. Along the way, we’ve helped change how the industry collects and understands data. Today, we’re using edge-powered, AI-driven systems on conveyors and vehicles, even underground.

WipWare continues to provide the industry with powerful tools to help companies monitor, measure and manage their materials the smart way. Our state-of-the-art arsenal of analyzers measure particle size, shape, volume and colour data in real-time on conveyor belts and vehicles. Our comprehensive software is useful anywhere to instantly determine particle size and shape distribution without using a scale object.

Always Evolving, Always Innovating

But we’re not done — today our tools continue to evolve.

We’re enhancing the way our systems capture material composition and volume — bringing deeper insights to operations of every size. Plus, we’re refining how data becomes decision-making power. And now we’re working to bring that same clarity everywhere from underground to outer space.

Thank you to our technical team, whose work ensures every system and line of code is field-ready and rock solid.

Thank you to the innovators whose commitment, structure, and continuity make every innovation sustainable and scalable!

And most importantly, to our clients, resellers, and partners around the world — thank you for 30 incredible years. Here’s to what’s next. YOU are the reason our WipWare Team continues to push boundaries. Your trust, feedback, and collaboration fuel the team purpose. Whether you’re analyzing underground ore, surface muckpiles, aerial drone images, conveyor material, or vehicle loads, your success is our mission.

Here’s to 30 years of innovation, reliability, and excellence… And to the next decades of digital transformation in mining and material handling.

Northern Ontario Mining Showcase North Bay & District Chamber of Commerce CIM/ICM Northern Gateway Branch MineConnect

Company

Understanding P80 in Crushing and Material Processing

Introduction

In the field of mineral processing and comminution (crushing and grinding), accurate size analysis is essential for optimizing the performance of crushing circuits and downstream processing units. Effective rock breakage using explosive energy requires a well-optimized blast design to ensure the energy is directed into the rock mass for maximum fragmentation and minimal waste. A properly executed design enhances breakage efficiency, improves downstream processing, and produces consistent material sizes measurable through Particle Size Distribution (PSD), which represents the proportion of different particle sizes within a fragmented material sample. One of the most critical parameters used in particle size distribution (PSD) analysis is P80, which stands for the particle size at which 80% of the sample material passes. This article discusses the definition, importance, and application of P80 in the crushing process and overall mineral processing operations.

What is P80?

P80 refers to the particle size (usually expressed in micrometers or millimeters) at which 80% of the sample’s mass passes through a given screen size. It is derived from the particle size distribution curve and provides a representative measure of the overall coarseness or fineness of a crushed or ground product.

For example:

  • If the P80 of a crushed ore is 120 mm, it means that 80% of the mass of that sample will pass through a 100 mm screen.

How is P80 Determined?

P80 is typically determined through:

  1. Sieve Analysis: The material is sieved using a stack of screens of decreasing mesh size. The cumulative mass retained is plotted to generate the PSD curve.
  2. Automated system: In automated systems like WipFrag 4, Reflex 6, and Solo 6, image-based particle size analysis can generate PSD curves without physical sieving, using photoanalysis techniques.
Chart showing PSD analysis
crushing and grinding, mineral processing

Importance of P80 in Crushing and Mineral Processing

1. Crusher Design and Operation Control

The efficiency of crushers and grinding mills is largely influenced by the target P80:

  • Primary crushers may target a P80 of around 100–150 mm.
  • Secondary crushers aim for a P80 of 20–40 mm.
  • Grinding mills (ball or SAG mills) often target a P80 of 75–150 µm for mineral liberation.

Setting and monitoring a P80 helps ensure the crushing process delivers the required product size for efficient downstream separation.

2. Grinding Circuit Efficiency

The Bond work index (BWI) is a well-known method used when selecting comminution equipment, to evaluate the grinding efficiency and to calculate the required grinding power (Nikolić et al., 2021). Determining the BWI is part of the design phase of a mining plant and can significantly affect the design costs associated with comminution. Mining comminution processes are the most energy intensive, and also the area with the greatest potential for energy savings. Accurate determination of the BWI is essential for the proper design and estimation of the costs associated with the comminution process.

P80 is critical in the Bond Work Index (BWI) equation:

W=10×Wi×((P80^-0.5)−(F80^-0.5))

Where:

  • W is the energy required (kWh/t),
  • Wi is the Bond Work Index,
  • F80 is the 80% passing size of the feed,
  • P80 is the 80% passing size of the product.

This relationship shows how energy input depends on the size reduction from F80 to P80. Thus, optimizing P80 can reduce energy consumption and cost.

3. Liberation and Recovery

In mineral processing, liberation of valuable minerals is essential before separation (e.g., flotation, leaching, magnetic separation).

  • If P80 is too coarse, incomplete liberation may occur, reducing recovery.
  • If P80 is too fine, overgrinding may lead to slimes that reduce separation efficiency and increase reagent consumption.

An optimal P80 ensures maximum liberation with minimal energy and operating cost.

4. Crusher-Compatibility and Throughput

When processing material through a plant, particularly in multi-stage crushing, each unit must receive appropriately sized feed:

  • Oversized material can cause crusher choking or blockages.
  • Undersized material may result in under-utilization of capacity.

By targeting a consistent P80:

  • You ensure crusher feed compatibility.
  • You maintain steady throughput and minimize downtime.

5. Process Control and Optimization

In modern mineral processing plants, real-time monitoring of P80 allows dynamic control:

  • Adjusting crusher settings (CSS),
  • Managing screen decks or vibrating screen performance,
  • Automating grinding media addition in mills.

Image analysis tools likeSolo 6enable on-belt PSD analysis, providing operators with live P80 data for feedback control either before crushing or after crushing.

Conveyor analysis system over a conveyor belt
crushing and grinding
mineral processing

Factors Influencing P80

Several factors impact the actual P80 of a crushed or ground product:

  • Rock hardness and competency
  • Crusher/mill type and operating parameters
  • Blasting quality and fragmentation
  • Screening efficiency
  • Ore variability and moisture content

Continuous monitoring and adjustment are crucial for maintaining a consistent P80 under changing conditions.

Typical P80 Targets by Process Stage

Primary Crushing: 100 mm – 250 mm

Secondary Crushing: 20 mm – 80 mm

Tertiary Crushing: 5 mm – 20 mm

SAG Mill Discharge: 1 mm – 3 mm

Ball Mill Product: 75 µm – 150 µm

Flotation Feed: 106 µm – 150 µm

Leach Feed: 50 µm – 100 µm

Conclusion

P80 is one of the most significant performance indicators in crushing and material processing. It serves as a benchmark for:

  • Crusher performance evaluation
  • Grinding circuit design
  • Energy efficiency analysis
  • Liberation optimization
  • Quality control and process automation

A well-controlled P80 not only improves the economics of mineral processing but also ensures better recovery and operational stability. With the rise of automation and image-based analysis systems, monitoring and optimizing P80 has become more precise and actionable, empowering engineers and operators to make data-driven decisions.

Reference

Nikolić, V., & Trumić, M. (2021). A new approach to the calculation of bond work index for finer samples. Minerals Engineering, 165, 106858.

WipWare Solo 6 Conveyor Belt System Overview

Company

How to Interpret Histogram and Sphericity Lines on the PSD chart

March Newsletter

Introduction

WipFrag software provides detailed fragmentation analysis through histograms and Particle Size Distribution (PSD) charts. These tools help users assess particle size consistency and shape uniformity, which are critical for optimizing blasting and crushing operations. Two among the key elements in WipFrag analysis are the histogram and the sphericity lines on the PSD chart.

Interpreting the WipFrag Histogram

The histogram in WipFrag displays the frequency of particle sizes within specific bins, helping to visualize fragmentation trends. Here’s how to analyze it:

  1. X-Axis (Particle Size Ranges): Represents particle size classes based on the sieve analysis standard.
  2. Y-Axis (Frequency or Percentage Passing): Shows the proportion of material in each size class.
  3. Histogram Shape:
    • A normal distribution suggests well-balanced fragmentation.
    • A right-skewed distribution indicates excessive fines.
    • A left-skewed distribution suggests large boulders dominate.

By analyzing the histogram, users can determine whether the blast produced the desired fragmentation or if adjustments are needed in blast parameters.

Understanding Sphericity Lines on the PSD Chart

Sphericity represents the ratio of particle length to width, indicating shape uniformity. WipFrag incorporates sphericity lines on the PSD chart to provide insight into particle geometry:

  • 100% Sphericity: Indicates perfect uniformity (equal length and width).
  • 70-90% Sphericity: Represents well-shaped, near-uniform particles, ideal for crushing and handling.
  • Below 70% Sphericity: Suggests elongated or irregularly shaped particles, which may impact flowability and crusher efficiency.

Why Sphericity Matters

  • Higher sphericity (>70%) improves material flow and crusher compatibility.
  • Lower sphericity (<70%) may cause blockages in crushers and conveyors.
  • Well-distributed sphericity values indicate a good mix of particle shapes.

Interpreting WipFrag histogram and sphericity lines helps assess fragmentation quality and shape uniformity. By understanding these parameters, mine operators can fine-tune their blasting strategies for optimal size distribution and material handling efficiency.

Download WipFrag here: https://wipware.com/products/wipfrag-image-analysis-software/

How to Use WipFrag for Blasting Quality Control (QC)

WipFrag, a leading photoanalysis software, enables real-time fragmentation assessment, helping engineers and operators maintain blasting quality control (QC) and improve efficiency.

Step-by-Step Guide to Using WipFrag for Blasting QC

  1. Image Capture and Data Collection
    • Capture high-quality images of the blast muck pile using a UAV (drone), camera, or mobile device.
    • Ensure proper lighting and image clarity for accurate particle detection.
    • Use WipFrag’s Auto Scale feature or place a scale reference in the image for precise measurements.
  2. Image Processing and Fragmentation Analysis
    • Upload images into WipFrag software.
    • Use the Edit Assist tool to refine particle outlines and improve accuracy.
    • Generate a Particle Size Distribution (PSD) curve to analyze the fragmentation results.
  3. Assessing Fragmentation with Histograms and PSD Charts
    • Histogram Analysis: Identify particle size frequency and distribution trends.
    • Specification Envelope: Compare fragmentation results with the desired range for crusher compatibility.
    • Sphericity Lines: Assess shape uniformity to ensure good material flow.
  4. Boulder Identification and Oversize Control
    • Utilize WipFrag’s Boulder Count tool to detect and quantify oversize particles.
    • Identify areas where secondary breakage or blasting adjustments are needed.
  5. Continuous Improvement and Optimizaton
    • Compare multiple blasts using WipFrag’s Merging Feature to track fragmentation trends.
    • Adjust blasting parameters (e.g., burden, spacing, explosive charge) based on data insights.
    • Improve fragmentation efficiency by reducing fines and oversized materials.

Conclusion

WipFrag is a powerful tool for Blasting QC, enabling operators to measure, analyze, and optimize fragmentation performance. By integrating WipFrag into the blasting workflow, mining professionals can achieve better consistency, reduce operational costs, and enhance overall efficiency.

Company

Social Media Connections with WipWare

Thumbs up technology chip image

Are you looking for our social media connections and information about WipWare’s products and services? Well look no further. There are several places you can find out all about us.

For WipFrag information, you can connect with our technical specialist Blessing (Giant Miner). Blessing posts interesting and informative articles about WipFrag. He is also available to assist you with any questions or schedule WipFrag training and seminars.

Giant Miner’s social media connections: Facebook, Instagram, LinkedIn, and X

Also, we have our website to provide you with information about our products and services:

WipWare Photoanalysis Systems logo

Home Page – Find all the links you need to navigate our website. This includes documents to download, products, services, events and newsfeed.

WipWare's Solo 6 logo

Solo™ 6 Conveyor Analysis System analyzes material on conveyor belts in real-time to automate your process. Establish quality control and improve safety, efficiency and throughput without disrupting production.

WipWare's Reflex 6 logo

Reflex™ 6 Vehicle Analysis System focuses on acquiring high quality images that are processed onboard. Designed for use on moving HD, LHD and railcar vehicles at the primary crusher without disrupting production. Laser triggering capabilities to sense the location of the truck before capturing images. Provides real-time telemetry to your control system, data historian or automatic daily reporting.

WipWare's WipFrag 4 logo

WipFrag™ 4 Image Analysis Software provides instant PSD analysis of digital images. Collect images at the muckpile after a blast, a closer up sample of a stockpile, a laboratory sample or drone/UAV images. With auto-scaling capabilities, WipFrag 4 is safe, cost effective and the most accurate fragmentation analysis tool in the world.

Also, you can make social media connections with WipWare on our social media pages.

For additional information, events taking place and product information:

WipWare: Facebook, Instagram, LinkedIn, X and YouTube.

en_USEN