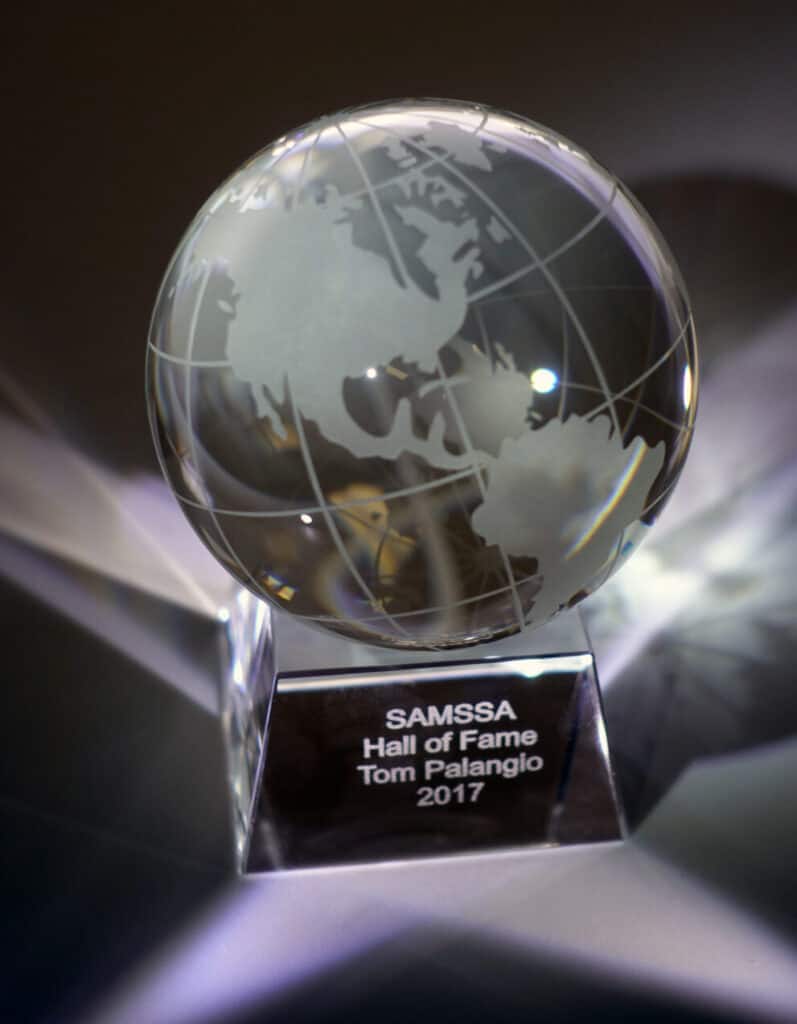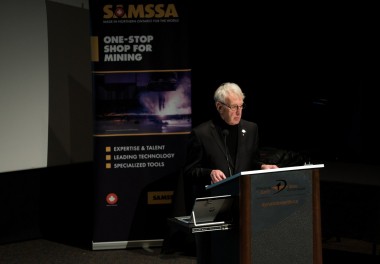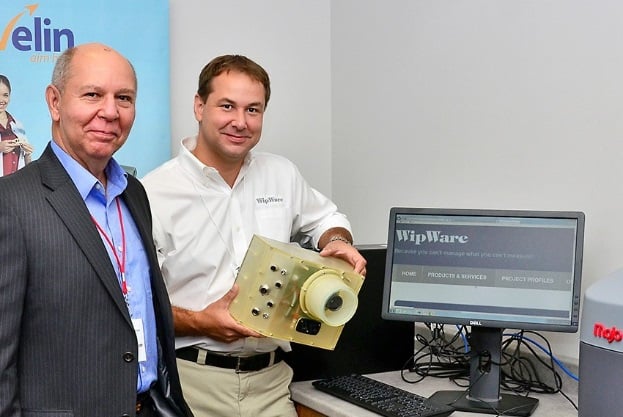
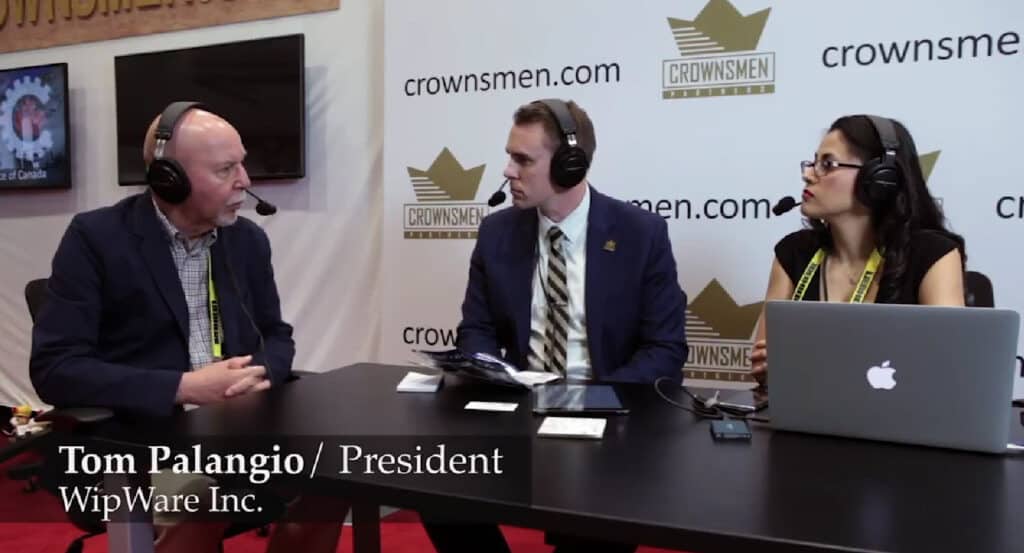
At the CIM 2018 in Vancouver, President of WipWare, Tom Palangio sat down with Jerrod Downey of Crownsmen Partners. They discussed Automatic Real-Time Fragmentation Analysis and the changes that technology is bringing to the mining industry.
How WipWare got its Name
One of the questions frequently asked is how the name WipWare came about. The WIP stands for Waterloo Image Process – take a picture of broken material and get engineering data from it. Tom and some Waterloo colleagues developed the technology that WipWare uses today in their WipFrag real-time fragmentation analysis software.
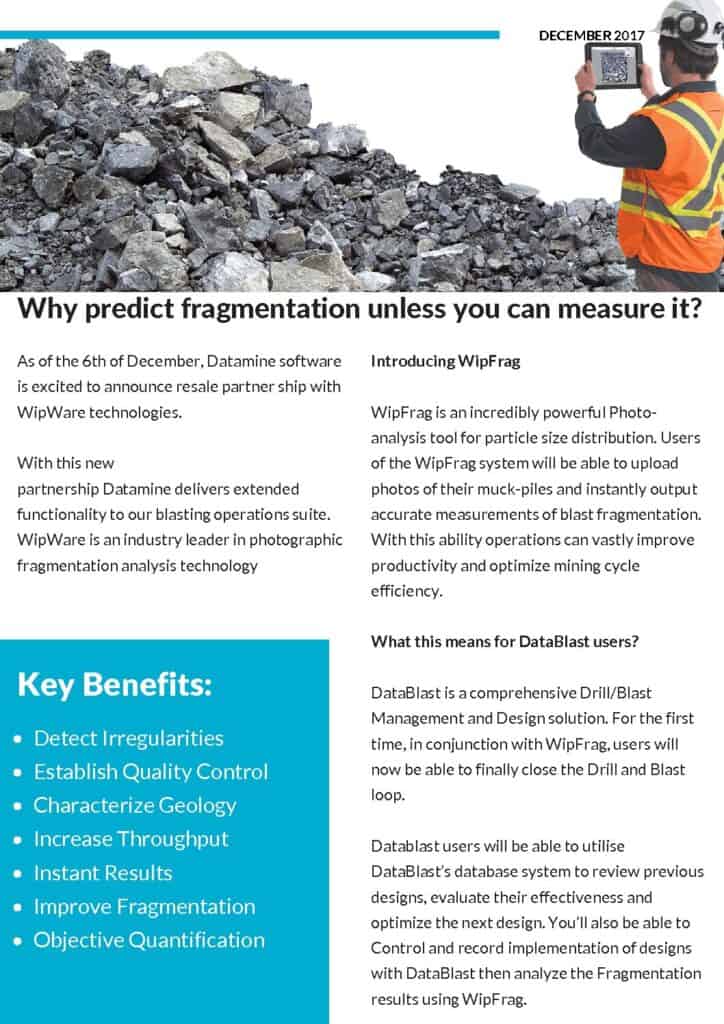
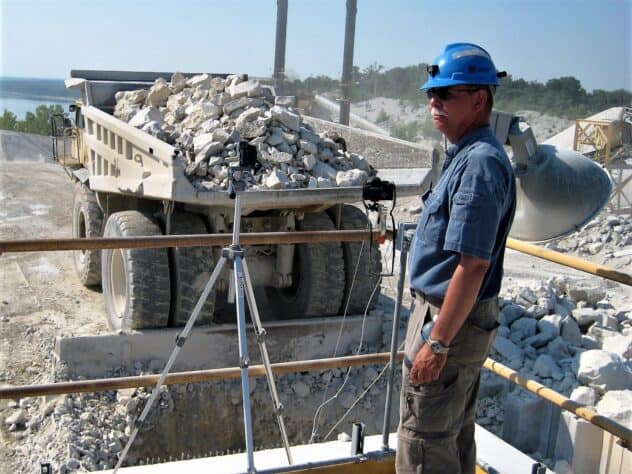
Before technology like WipFrag, you’d look at a blast and have to visually try to determine if it was good. Another method was to stop the belt and take a manual sample. Then, wait for the sieve results which could take hours, even days. So, by the time the results came back, they weren’t actionable and this was an ineffective method. With WipWare’s fragmentation analysis systems and software, you get real-time results immediately to make quantitative decisions to improve your processes.
Cutting Edge Technology
In the past, “it has been difficult to introduce new technology into a traditional business”. The mining industry “hasn’t always been receptive to change”. With remote sensing, robotics and automation becoming common technology, WipWare’s real-time fragmentation analysis systems and software is on the cutting edge of this new technology.
Now, the mining industry is becoming more receptive to automatic processes. Tom explains, “Our technology allows you to measure material in real-time. If you’re off spec, you can adjust it and it’s not disruptive”. Imaging, computer and sensor technology has really improved. Tom states, “We thought creating the data…was a reason for being…but it’s getting the data to the people that can act on it”.
Mobile Device Compatibility
Two years ago, WipWare decided to integrate the technology onto mobile devices and introduced WipFrag iOS. There were over 5000 downloads in 18 months and WipFrag iOS is now available through the App Store.
The mining industry is not the only industry that our technology can be utilized. Other industries include medicine, agriculture, chemical industry and the explosives industry just to name a few – anywhere that you have materials and want to detect contamination.
The applications are numerous and it’s always exciting to find new applications for WipWare technology.