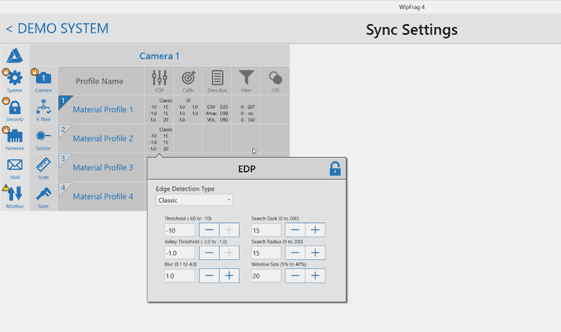
Какие параметры обнаружения края (EDP) мне следует использовать?
1ТП1Ц•
Какие параметры обнаружения края (EDP) мне следует использовать?
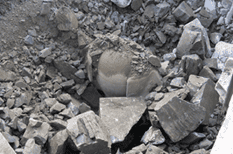
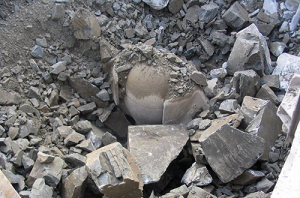
При использовании WipFrag для анализа навозных куч вы можете руководствоваться следующими рекомендациями:
Штрафы = ползунки вправо
Средний = ползунки посередине
Большой = ползунки влево
Generally, you want to have accurate nets on the small- to medium-sized particles. Once you find a suitable net for this size of material you can manually edit the larger material. Using this method will help provide more accurate results.
It’s also recommended that you try to keep a similar EDP for images of the same muck pile, or when trying to compare different muck piles.
If finer adjustments are required, you can activate the ‘Show Advanced Controls’ checkbox to access numeric inputs featuring a wider range of finer adjustments than the basic sliders provide.
WipWare Automated Photoanalysis Systems and EDP
В Delta, расширенной версии программного обеспечения WipFrag, которое работает в автоматизированных системах фотоанализа WipWare, мы используем процесс, называемый Best Fit EDP. Для онлайн-систем этот процесс обычно выполняется на месте во время установки. Это реализуется путем получения изображения типичного материала после завершения всех настроек оборудования и программного обеспечения. Мы вручную отслеживаем как можно больше частиц, а затем запускаем функцию Best Fit EDP. Затем программа попытается сопоставить ручную трассировку частиц с использованием доступных настроек EDP. Best Fit EDP выводит набор числовых значений, которые будут введены в расширенные элементы управления EDP. Этот метод очень точен и предоставляет нашим онлайн-системам хорошо подходящие параметры обнаружения края. Редко, когда требуется изменить онлайн-систему EDP, но это можно сделать удаленно из нашей штаб-квартиры.
Best Fit EDP was recently added to WipFrag software. Because of the time involved in editing an image to produce a good Best Fit EDP, this feature is most practical to reduce the amount of manual editing required if you are going to be analyzing many images (20, 30 or more) of the same material under the same conditions. For most users, where smaller batches tend to be analyzed at once, using the sliders to adjust the EDP is faster.
Within WipFrag, there is also a feature called Auto EDP which attempts to determine the edge detection parameters automatically. This feature works well if the particle size range is narrow.
Вы новичок в технологии фотоанализа? Возможно, у вас есть установка, и вы хотите исследовать другие места для повышения эффективности? Читайте дальше о некоторых из самых популярных локаций WipWare.
Where would be an ideal location to install your technologies?
There are 5 main locations where photoanalysis technologies are installed, all of which have a similar theme of analyzing material after it has been reduced in size. I’ve listed a few (of the many) popular locations, from the mine to the mill:
Blast Fragmentation
Unlike conveyor belt technologies, blast fragmentation systems are providing particle sizing data that would otherwise be unquantifiable. As an example: When mine team is asked how they were determining blast performance, they responded with: “Well, we try to compare it just by looking at it”. By putting quantifiable values beside the material being dumped into the primary crusher, we eliminate any bias and baseline the blasting performance.
Now, think for a second how much cheaper it would be, if you could do most of your material breaking in the blasting phase: Reduced crusher needs, less maintenance on equipment, and significantly reduced energy costs to name a few of the benefits of optimizing blasting procedures.
Post-primary/Post-secondary crusher
Either Jaw, Gyratory, or Cone, whatever type of crusher you use to break down your material, if it’s primary, secondary or tertiary crushing, you should be looking into evaluating the performance of those crushers, in order to a) maximize liner life, b) make crusher gap adjustments, c) change worn out liners before oversize contaminates your stockpile, d) improve overall crusher throughput.
See, most crusher maintenance schedules are based on a fixed timeline, when many variables can affect the lifetime of the liners. Think ore hardness, size, etc.
Фактически, возвращаясь к предыдущему сообщению в блоге, вы можете начать автоматизировать эту часть вашего процесса для максимальной эффективности.
Screen Breakages
Если вам нужны немедленные индикаторы поломки экрана или износа, технологии фотоанализа могут очень хорошо обнаружить негабаритный материал после досмотра. Например, производители агрегатов видят значительную ценность в выявлении материалов, не соответствующих спецификациям, сразу после выявления неисправности экрана.
SAG Optimization
This is probably the location with the biggest potential return on investment, and is the most common first installation: Imagine controlling your stockpile blend based on continuous particle sizing information. Being able to optimize SAG feed can save an operation significant cost in a variety of areas.
Знайте, когда кормить с более грубых сторон кучи или с середины.
Understanding Size Ranges in Conveyor Belt Analysis
1ТП1Ц•
How Low Can You Go?
One of the most common questions we receive is, “How small can you analyze?” The answer depends on multiple factors, but with the right imaging, WipWare’s systems can measure down to micron levels. However, when analyzing material on conveyor belts, additional considerations impact the minimum particle size that can be accurately measured.
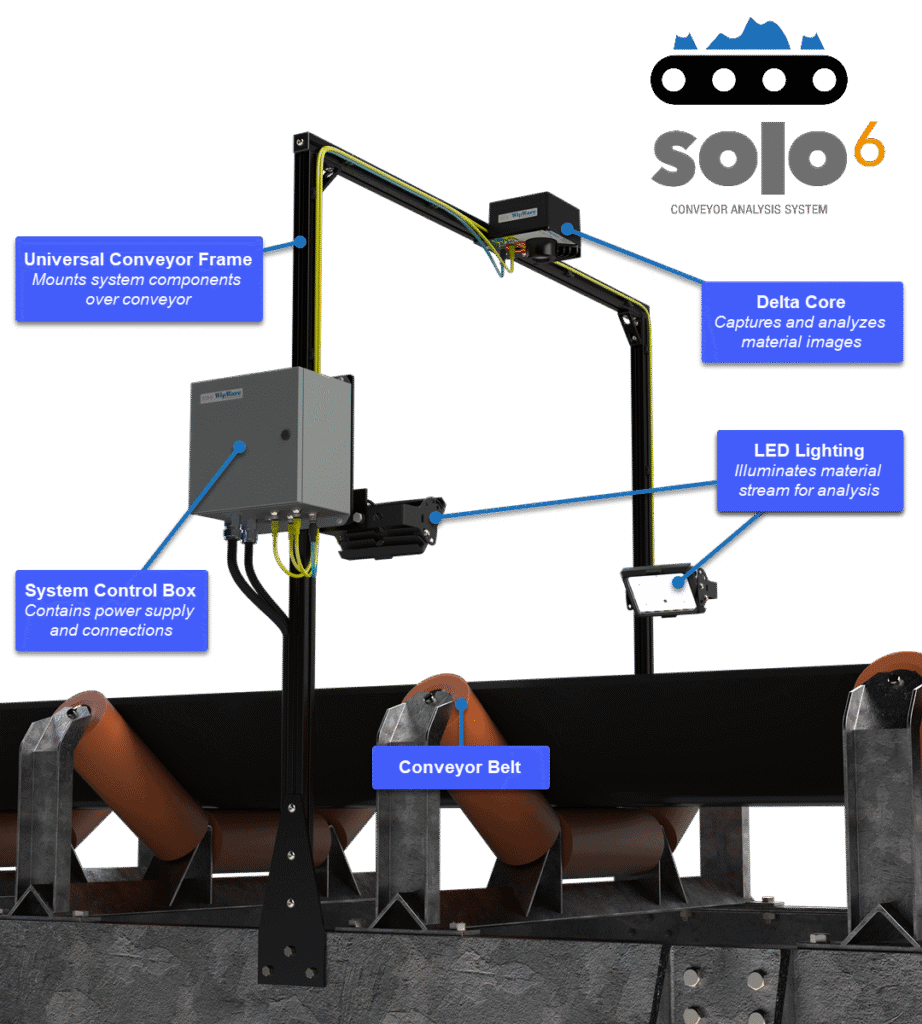
Over the years, we’ve worked with a vast range of conveyor belt applications from highly quality-controlled 10-inch belts to massive run-of-mine conveyors that are several metres wide as is normally found in global copper, iron ore mine operations. Our fully adjustable frames are customized before shipping to ensure seamless integration into your operation.
Key Considerations for Conveyor Belt Analysis
When it comes to analyzing material on conveyor belts, a few fundamental factors come into play:
Fixed Camera Position – The camera is mounted at a consistent distance from the belt, usually within a metre or so (a few feet).
Controlled Lighting – Conveyor belt environments generally offer stable lighting conditions, improving image accuracy.
Material Spread – The material stream typically covers a predictable portion of the belt rather than the entire conveyor surface, allowing the camera to focus specifically on the material.
Controlled Flow – Conveyed material has a known source and destination and moves at a controlled speed and direction, making variables easier to control.
With these stable conditions, WipWare’s systems can precisely determine the size ranges they analyze for each application.
Real-World Examples
Let’s explore two real-world examples using WipWare’s Соло system:
Компания
ABC Company
XYZ Company
Material Type
Copper
Gold
Conveyor Dimensions
3 metres / 10 feet
1.2 metres / 4 feet
Analysis Location
Primary crusher output
SAG mill feed
Detectable Sizes
7.14 mm – 609.6 mm 0.2812 in (~#3) – 24 in
2.86 mm – 243.84 mm 0.1125 in (~#7) – 9.6 in
From the comparison table above, we see that ABC Company’s larger conveyor widths require the particle sizing system to be mounted higher to capture the full material spread. This setup means the system focuses more on coarser size fractions than fines – which is good: If a 3-metre belt is in use, and the material is raw primary crusher output, it’s unlikely that the material is 100% fines.
In contrast, Company XYZ deals with crushed and pre-screened materials, meaning the belt carries smaller particles. Since the conveyor is smaller in width, the system mounting height is closer to the material and can therefore analyze smaller size fractions.
Note: These are real-world examples with their own unique challenges which affect the detectable size range and goals which determine the focus of data collection. Your own application could have very different detectable size ranges depending on similar factors at your operation.
Expanding the Size Range: What are the options?
If you need to adjust the minimum or maximum detectable particle size, consider the following:
Calibrate for Unseen Fines – Using sieve data and manual belt cuts to measure unseen and unresolvable fines and calibrate the system output accordingly. This is good for known and predictable material streams.
Reduce the Field of View – Narrowing the system’s focus by adjusting the position or changing the type of lens used to view a smaller area. This in turn may limit the ability to capture coarser sizes.
Increase Camera Locations – Using multiple cameras on the same material stream to capture different ranges of material, ie. a “fines” camera and a “coarse” camera.
Tailored Solutions for Your Operation – The technology itself can change for your specific needs, such as increasing the camera resolution or changing the mounting solution.
If you’re wondering how effective a WipWare analysis system would be for your operation, свяжитесь с нами! Our technologies have helped mining operations worldwide achieve better process control.
Have a unique application? We love a challenge — send us the details, and we’ll be happy to assist!
Literature Review: Application of WipWare Technology
1ТП1Ц•
WipWare’s fragmentation analysis technologies have been widely applied across various mining operations to solve critical challenges. These were associated with material flow, fragmentation consistency, energy use, and overall process efficiency. I came across Том Палангио‘s works on numerous case studies highlighting the effectiveness of WipWare‘s tools. These tools optimized blasting practices and downstream processing. This review presents a summary of several influential studies and industrial applications of WipWare technology.
Photographic Fragmentation Analysis
Selbaie Mine, Joutel, Quebec, Canada
In the mid-1990s, Selbaie Mine utilized photographic fragmentation analysis using WipFragto assess explosive performance and optimize blasting patterns. The integration of WipWare technology enabled the mine to monitor and control several key performance indicators. Some of these indicators included energy consumption for crushing, loading rates, haul truck payloads, secondary blasting costs, and maintenance expenditures. Fragmentation data revealed a more comprehensive understanding of the effects of blast results on overall mining cost structures. This information allowed the mine to better manage ore processing operations. They could quantify the true cost of mineral handling based on fragment size.
Significant Pattern Optimization
INCO Coleman Mine, Sudbury, Ontario, Canada
INCO’s Coleman Mine used WipFrag during a detailed study in 1994, resulting in significant pattern improvement. The original tight blast pattern (5ft x 10ft) yielded a characteristic size (Xc) of 0.617 m, with substantial oversize material requiring re-blasting. Progressive expansion of the blast pattern to 6ft x 10ft and eventually 7ft x 10ft not only improved fragmentation (Xc = 0.318 m) but also reduced oversize entirely. WipFrag data was instrumental in determining optimal fragmentation, with INCO realizing up to 40% blast pattern expansion and 80% cost savings. Additionally, the technology allowed for reductions in fines generation, further streamlining ore handling and improving crusher feed quality.
Correlate Ore Fragmentation and Hardness with Mill Performance
Highland Valley Copper, Logan Lake, British Columbia, Canada
At Highland Valley Copper (HVC), the team used WipWare tools to correlate ore fragmentation and hardness with mill performance. WipWare’s WipFrag software, Reflex vehicle analysis system and Solo conveyor analysis system played a central role in tracking ore size distributions from the pit through to the mill feed. This enabled real-time optimization of crusher and mill settings. The mine’s dispatch system integrated fragmentation data to guide stockpile management and minimize feed segregation. WipFrag analysis revealed that feed consistency across the grinding lines could be improved by adjusting feeder ratios. This capability to quantify fragmentation effects allowed HVC to perform cost benefit analyses and optimize the balance between blast quality and mill throughput.
Detonator Timing Accuracy and Improved Fragmentation using WipFrag
Bartley and Trousselle – Ogdensburg, New York, USA
At Benchmark Materials Quarry, Bartley and Trousselle demonstrated the link between detonator timing accuracy and improved fragmentation using WipFrag. Digital programmable detonators yielded superior blast uniformity and reduced vibration levels. WipWare’s image analysis facilitated the evaluation of blast performance improvements by providing accurate fragmentation size distribution data.
The Effects of Improved Fragmentation on Mechanical Performance and Power Usage in the Crushing Circuit
Lafarge Canada Inc. – Exshaw, Alberta, Canada
Lafarge’s Exshaw operations applied WipFrag to examine the effects of improved fragmentation on mechanical performance and power usage in the crushing circuit. A redesigned blast using 102 mm holes led to more uniform fragmentation. This resulted in a 16% increase in crusher throughput and a 30% reduction in power consumption. WipWare data also informed decisions related to equipment selection (e.g., drill bits) and wall control, leading to improved safety and reduced vibration impacts on neighboring communities.
Cost-Effective and Reliable Fragmentation Assessment Tool
Barkley and Carter – Evaluation of Optical Sizing Methods
Barkley and Carter evaluated WipFrag as both a cost-effective and reliable fragmentation assessment tool. Their work highlighted that previous blast optimization efforts were constrained by the lack of efficient sizing techniques. In contrast, WipFrag enables meaningful decision-making in blast modeling, mining method selection, and economic planning. The study underscored the significance of image-based sampling frequency, particularly in varied muck pile conditions, to derive actionable insights on crusher performance and feed consistency.
Assess Fragmentation and Stemming Uniformity
Chiappetta, Treleaven, and Smith – Panama Canal Expansion
During the expansion of the Panama Canal, WipFrag was employed to assess fragmentation and stemming uniformity in complex geological and logistical conditions. The integration of WipWare into blasting operations enabled engineers to both track blast outcomes and support adaptive design decisions in real time. In a project characterized by not only marine traffic but also saturated zones and tight deadlines, the technology provided essential support in achieving controlled fragmentation and predictable material handling.
Conclusion
These reviewed case studies emphasize WipWare’s critical role in improving the efficiency and economics of mining operations. Through accurate and real time fragmentation analysis, WipWare technologies facilitate optimization across the mine to mill value chain. From reducing energy consumption and equipment wear, to improving blast designs and minimizing fines, WipWare’s technologies offer robust solutions to a range of material flow problems in both surface and underground mining environments. These outcomes underscore the value of fragmentation analysis in modern mining practice, unquestionably supporting data-driven decision making and continuous process improvement.
By Blessing Taiwo
Рефлекс
Understanding the Fundamentals of Blasting and Fragmentation – Part 1
1ТП1Ц•
Introduction
Blasting is a critical operation in mining, quarrying, and construction that involves the controlled detonation of explosives to break rock into manageable fragments. The fundamental principle behind blasting lies in understanding the interaction between explosive energy and rock mechanics, particularly the propagation of shock waves and the subsequent formation of fractures.
The Shock-Wave Theory of Blasting
The shock-wave theory provides a framework for understanding how explosive energy transforms into mechanical work, breaking the rock. As mentioned by Hino, (1956), when an explosive charge detonates, it generates an intense shock wave accompanied by a rapid release of gas and energy.
This energy produces two primary effects:
1. Crushed Zone Formation:
Near the explosive charge, the rock undergoes intense compressive stress, exceeding its compressive strength. This creates a crushed zone, a region where the rock is pulverized into fine fragments. However, because rocks generally have a high compressive strength, this crushed zone is limited to the immediate vicinity of the charge.
Figure 1 )Shadab Far et al., 2019)
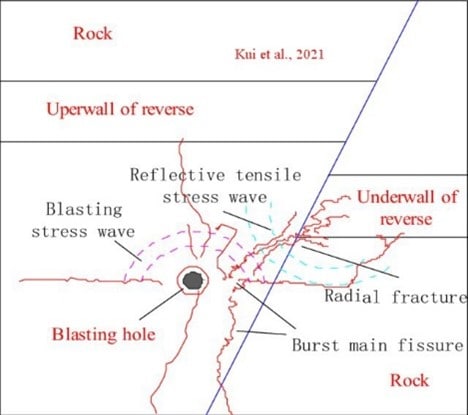
2. Shock Wave Propagation:
Beyond the crushed zone, a high-pressure shock wave propagates outward as a compressive wave. This wave does not immediately cause rock breakage but transfers energy through the rock mass.
At the first free face (a boundary with no external constraint, such as the surface of a bench or tunnel wall), the compressive wave reflects as a tensile wave. In rock mechanics, this transition is crucial because rocks are significantly weaker under tensile stress than under compressive stress. As the tensile wave interacts with the rock, fractures form when the effective tension the difference between the reflected tensile wave and any residual compression exceeds the rock’s tensile strength (Himanshu et al., 2024).
Thickness of the First Slab and Fragmentation
The initial fracture caused by the tensile wave occurs at a distance from the free face known as the thickness of the first slab (Hino, 1956). This distance is critical because:
It determines the size of the initial fragment.
Other fragment dimensions are generally proportional to this thickness.
If the remaining compressive wave retains sufficient energy after the detachment of the first slab, it continues propagating outward (See Figure 2). This process repeats at newly created free faces, producing successive layers of fractures and reducing the rock into smaller fragments. The cycle continues until the energy of the compressive wave diminishes below the tensile strength of the rock.
The interaction between these phenomena: shock wave propagation, energy dissipation, and rock strength, governs the fragmentation process. Understanding these principles allows blasting engineers to optimize blast designs to achieve desired fragment sizes, minimize blast induced issues like ground vibration, flyrock, overbreak, and ensure efficient downstream operations.
Factors Affecting Shock-Wave Propagation and Fragmentation
Several factors influence the effectiveness of a blast and the resulting fragmentation:
1. Explosive Properties
The energy content, detonation velocity, and confinement of explosives significantly affect the shock wave’s intensity and duration.
2. Rock Properties
Variations in rock strength, density, and structure (e.g., joints, fractures, and bedding planes) influence the propagation of shock and tensile waves.
3. Blast Design Parameters:
Hole diameter, spacing, burden, and the placement of charges determine the distribution of energy and the resulting fragmentation.
4. Free Face Orientation:
The presence and orientation of free faces play a pivotal role in enabling tensile wave reflection and fracture initiation.
5. Energy Distribution:
Proper distribution of explosive energy ensures uniform fragmentation and minimizes the generation of oversize boulders or fines.
Importance of Fragmentation in Mining Operations
Effective fragmentation is essential for the efficiency and cost-effectiveness of mining operations. Well-fragmented rock facilitates:
Reduced loading and hauling costs.
Improved crusher throughput and efficiency.
Lower energy consumption in downstream processing.
Enhanced safety by minimizing the occurrence of hazardous oversize boulders.
Importance of Assessing Blast Performance and Output
WipFrag, a state-of-the-art image analysis software, revolutionizes the assessment of blast performance and fragmentation. By analyzing images of fragmented rock, WipFrag provides precise and actionable insights into the quality of a blast. Here’s how WipFrag enhances blasting operations:
1. Particle Size distribution (PSD) Analysis:
WipFrag generates PSD curves that quantify the size range of rock fragments, enabling operators to evaluate whether the fragmentation meets specifications.
2. Specification Envelope Assessment
The software allows users to define specification envelopes for crusher-compatible fragmentation. Deviations from these envelopes highlight areas for improvement in blast design.
3. Boulder Identification and Counting:
WipFrag’s advanced algorithms detect and count oversize boulders, providing critical data for optimizing explosive placement and burden.
4. Image Merging and Orthomosaic Integration:
The capability to merge multiple images ensures comprehensive analysis of large muck piles. Integration with drone orthomosaics enables wide-area assessment of blast results.
5. Continuous Improvement:
By comparing fragmentation results across blasts, WipFrag supports continuous improvement in blasting practices, reducing costs and improving efficiency.
6. Real-Time Analysis:
Integration with systems like Solo 6 and Reflex 6 facilitates real-time monitoring and analysis, ensuring immediate feedback for decision-making.
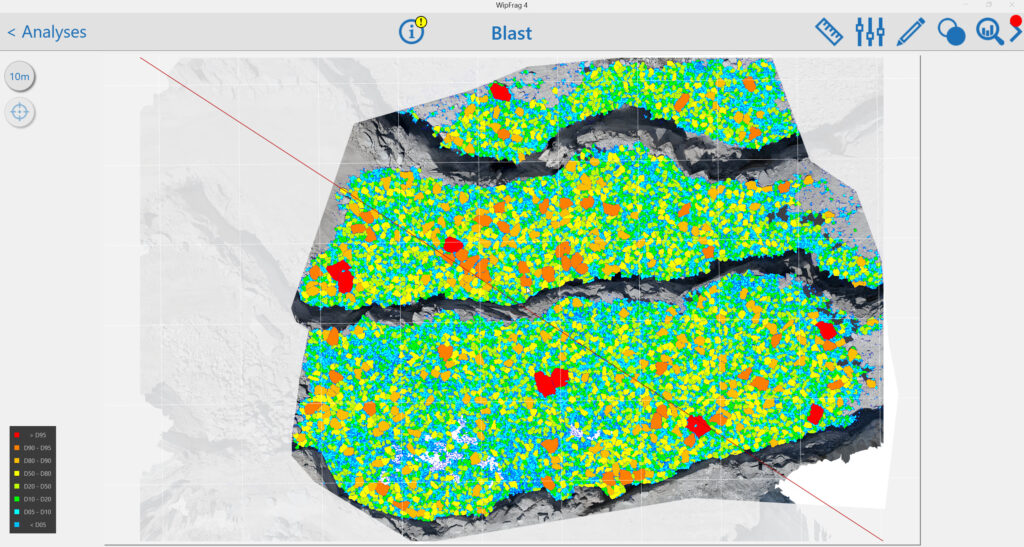
Figure 3
Figure 3 showcases results obtained from the WipFrag software, illustrating its capabilities in fragmentation analysis.
Figure 3a presents the GIS-integrated on-site fragmentation assessment. This feature, embedded within WipFrag, allows users to visualize blast results spatially. The red sections of the GIS map highlight areas with poor blast outcomes, whereas lighter colors like blue and green represent zones with favorable fragmentation.
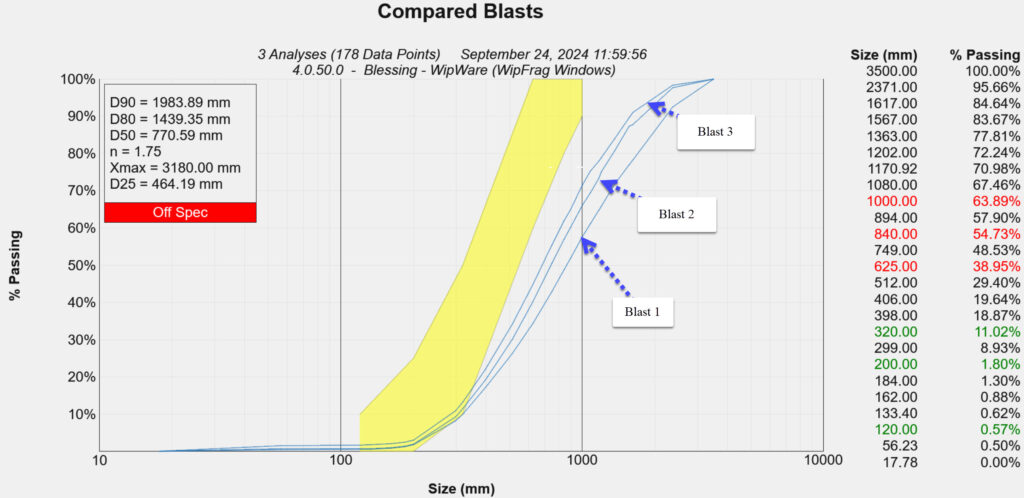
Figure 3c displays the Particle Size Distribution (PSD) curves comparing three different blasts. The yellow envelope outlines the production specification of the case study mine, serving as a benchmark. WipFrag enables each mine to define their Key Performance Indicator (KPI) sizes and utilize them for ongoing assessments. This facilitates the evaluation of blast improvements over successive rounds.
Additionally, the PSD curves feature size classifications and flag specific sizes that deviate from mine production requirements, ensuring precise monitoring and alignment with operational goals.
This comprehensive analysis provided by WipFrag aids in identifying areas of improvement, optimizing blasting strategies, and enhancing overall mining efficiency.
Conclusion
Blasting and fragmentation are complex processes driven by the interaction of explosive energy, rock mechanics, and blast design parameters. Understanding these fundamentals is essential for optimizing operations and achieving desired outcomes. WipFrag software plays a pivotal role in this optimization by providing detailed and accurate fragmentation analysis, enabling operators to assess performance, identify areas for improvement, and implement data-driven strategies for continuous enhancement. With tools like WipFrag, the mining industry can achieve safer, more efficient, and cost-effective blasting operations (download software here https://wipware.com/get-wipfrag/).
References
Hino, K. (1956). Fragmentation of rock through blasting and shock wave theory of blasting. In ARMA US Rock Mechanics/Geomechanics Symposium (pp. ARMA-56). ARMA.
Himanshu, V. K., Bhagat, N. K., Vishwakarma, A. K., & Mishra, A. K. (2024). Principles and Practices of Rock Blasting. CRC Press.
Shadab Far, M., Wang, Y., & Dallo, Y. A. (2019). Reliability analysis of the induced damage for single-hole rock blasting. Georisk: Assessment and Management of Risk for Engineered Systems and Geohazards, 13(1), 82-98.
Рефлекс
WipWare Photoanalysis System FAQs
1ТП1Ц•
We’ve put together some photoanalysis systems FAQs based on questions from our customers.
Does WipWare Technology give Real Time analysis results?
WipWare Image Analysis Systems produce real-time 24/7 results that allow personnel to identify, evaluate, and optimize troublesome areas of their process while maintaining production. Our systems are installed in many different applications around the world. These applications vary from analyzing wood chips to detecting oversize material or contamination in diamond mines. The applications are endless. From Mine to Mill The term Mine to Mill highlights the importance of fragmentation data on both the blasting and processing end of operations. This term applies well to WipWare line of products from the muckpile after a blast to analyzing material on the conveyor. Mine-to-mill technology takes the entire system into account, from the blasting process to the comminution circuit. This optimization provides a complete fragmentation and size reduction solution to maximize benefit. Программное обеспечение для анализа изображений WipFrag WipWare’s WipFrag 4 Image Analysis Software effectively analyzes data from a recent blast and produces results of the blast material on-site in minutes. Рефлекторная система анализа автомобиля From there, as the trucks haul the material to the primary crusher, you can detect oversize material or contamination and divert the material accordingly. Once at the primary crusher, our Reflex systems can detect oversize material, contamination or give full particle size distribution analysis as the material is dumped. Система анализа одиночного конвейера After the material has gone through this process our systems can continue to analyze the material on the conveyor belt. At this stage, you can determine what is the most important information you want to retrieve: detect oversize, divert material, identify contaminated material or receive full Particle Size Distribution data 24/7 in real-time. Now, here’s the cool part: our WipFrag software is also the HMI (Human to Machine Interface) for our systems. Not only can you use our software separately to analyze your blast material, but the same software is also used to analyze your material all along its journey from Mine to Mill.
What are the benefits of WipWare products?
Many potential customers ask this very question about the benefits of WipWare products. Well, here’s the answer. WipWare offers industry-leading photoanalysis technology for accurate, real-time fragmentation assessment, optimizing blasting, crushing, and grinding operations. With features like deep learning, auto-scaling, GIS compatibility, and orthomosaic analysis, WipWare ensures precise measurement and continuous improvement. The software’s specification envelope, histogram reporting, and boulder counting enhance decision-making, reducing downtime and costs. Additionally, WipWare provides flexible pricing, cross-shipping warranties, and expert support, making it the top choice for efficient mining and aggregate operations. Furthermore, our online Systems provide data to the customer 24/7 to identify troublesome areas of your process from Mine2mill. In conclusion, our Соло Basic or Complete, Рефлекс Basic or Complete and WipFrag software can drastically lower energy, and maintenance costs, as-well as cut equipment downtime and aid in quality control.
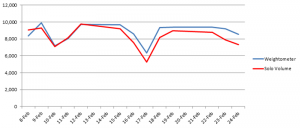
Как работает функция объемного измерения WipWare и как она может сэкономить вам деньги?
WipWare использует лазеры для точного определения глубины ленты для обнаружения обоих A) Пустые ремни, как и в предыдущих моделях Solo. Б) Глубина материала на конвейерной ленте When you tie the material depth information with the conveyor belt speed and your belt weightometer reading, you are able to extract the specific gravity of the material passing. Having the specific gravity information will allow you to determine whether the material passing is waste or ore-bearing material. В ходе предварительных испытаний на известняковой фабрике WipWare удалось достичь корреляции 94% между объемными вычислениями и показаниями ленточного весоизмерителя. Операция может использовать эту информацию для предотвращения попадания отходов в процесс дробления, что позволяет сэкономить значительные суммы денег на техническом обслуживании и затратах на электроэнергию. Volumetrics users have the added benefit of receiving accurate particle sizing results as well as another new feature allowing you to detect contamination. Благодаря тому, что данные о размере, форме, объеме и обнаружении загрязнения непрерывно передаются в реальном времени, автоматизированные технологии WipWare обеспечивают в три раза более точные показатели данных, чем у конкурентов.
What has WipWare technology been used for?
В WipWare мы часто называем себя поставщиком технологий для майнинга и агрегирования, поскольку эти две отрасли составляют большую часть нашего бизнеса. Прелесть технологий фотоанализа в том, что с подходящим изображением наши продукты могут анализировать все, от микронного материала до планет. Все мы знаем, что автоматическое определение размера частиц является важной частью горнодобывающей и агрегатной промышленности, но, как вы увидите, размер материала важен не только для горных пород. Вот несколько интересных приложений, с которыми мы имели удовольствие работать: Марсоход Curiosity: There may not be any mining on Mars (that we know of), but the Curiosity rover is taking pictures that are being analyzed for oversized obstacle detection. What a great way to identify and steer clear of obstacles and keep Curiosity roaming. Яичница-болтунья. That’s right, I said scrambled eggs. A food supplier from the US contacted us looking to optimize the fluffiness and fragmentation of the scrambled eggs they use. I’ll never look at scrambled eggs the same way ever again. Кимберлит обработанный: Getting out of our chef’s apron and putting our hard hats back on, we have been working very closely with multiple diamond companies around the world to accurately analyze the process kimberlite material on their conveyor belts. What’s so incredible about this application? Well, it’s pretty normal, except for the fact that the material ranges from as low as 1.2mm (0.0472440″ for our Imperial friends). Once again, if a suitable image can be captured, WipWare can analyze it. …And of course, we work with hundreds of applications that deal with broken screen detections, contamination, quality control procedures, pre- and post- crusher optimization and SAG mill throughput applications.
How can I see analysis (the) data?
Both Delta (Solo 6 and Reflex 6) and WipFrag produce a percentage passing curve visible after each virtual sieve analysis. It also saves the data to a CSV (comma-separated values) file. Each sieve analysis produces a new line in the CSV file that represents the results from the sieve. Этот CSV-файл содержит: – Timestamp (Year/Month/Day/Hour/Minute/Second) – D-values (XX% passed the specified size – Ex. 90% of the material passes 13.87 inches[352.30mm]) – User specified size classes (% passing or retained at the specified size) – Block (amount of particle detected) – Min, Max, Mean, St. Dev, Mode – Sphericity (The shape of the material – 0=Linear Objects 1=Perfectly Round) – Coverage (How much of the image is used) – Calibration Values (b, Xmax, X50, Xc and n) – EDP values (Edge Detection Values) – Calibration factors – System info (CPU temp, Board temp, Voltage checks) – System uptime – Camera setting at the time of the image. – Modbus and OPC poll rate – Vehicle Identification Information (Reflex Only) Delta (Solo 6 and Reflex 6) can e-mail these CSV files automatically as well as an average of the entire day on one passing curve. It also has a trending graph in the lower section of the software interface which trends the data for the current day. Кроме того, Delta имеет возможность выводить аналитическую информацию, используя соединение Modbus или OPC, для передачи информации в ваш архиватор, PLC или HMI.
Какое регулярное обслуживание требуется для систем фотоанализа WipWare?
Единственное регулярное обслуживание, необходимое для наших систем, - это обеспечение чистоты линз и светильников с минимальным количеством пыли и грязи. Частота очистки системы будет зависеть от среды, в которой она работает: ОКРУЖАЮЩАЯ СРЕДА / ЧАСТОТА Очень пыльно 1-3 недели Умеренная пыль 2-6 недель Небольшое количество пыли или ее отсутствие 4-8 недель Метод 1: водяной шланг The first method is the most common. Using a water hose, simply spray down the system ensuring the lens is clean and free of any noticeable dust or dirt. If possible, use a squeegee to remove any droplets that may remain on the lens. Doing this helps prevent dust from collecting in the droplets that remain which could leave deposits on the lens that interfere with image capture. Since our systems are completely waterproof this method is usually the easiest and most effective way to clean the lens. It can also be done without having to shut down the conveyor belt. Метод 2: чистая влажная ткань / бумажное полотенце. Другой вариант - использовать чистую влажную ткань или бумажное полотенце, смоченное водой или Windex. Идеально было бы использовать чистую ткань из микрофибры, но ее может быть трудно найти на рудниках. Старайтесь не нажимать слишком сильно при протирании объектива, скопившаяся пыль может оставить царапины на объективе, если приложить слишком большое давление. Примечание. При температурах ниже нуля воздержитесь от использования воды или Windex, так как они замерзнут на линзе и вызовут неадекватное качество изображения. Мы рекомендуем использовать стандартные омыватели ветрового стекла, рассчитанные на правильную отрицательную температуру. Метод 3: сжатый воздух It’s also acceptable to use compressed air from a can or hose to dust off our systems. This method works well but will kick up a lot more dust than the liquid methods. We recommend using a dust mask when using compressed air to clean off out systems.
Can Delta (Solo 6 and Reflex 6) store the images captured by automated systems?
Простой ответ - да. The computer can store up to 1000MB worth of images without any issues. Once beyond this point the hard drive could start having problems accessing the image folder causing the computer to run slower than normal, so the oldest images are overwritten automatically. Примечание. Все данные о размере частиц хранятся в файле CSV, который имеет гораздо меньший размер и позволяет хранить данные на более длительной временной шкале. В большинстве наших систем используется камера с разрешением 1,2 мегапикселя, и размер изображений в среднем составляет 180 КБ каждая, поэтому в 1000 МБ памяти можно разместить примерно 5600 изображений. Running 24 hours per day the system can roughly save the following number of images: Если вы делаете 1 изображение каждые 20 секунд, у вас будет 4320 изображений в день. ~ 31,2 часа Если вы делаете 2 изображения каждые 20 секунд, у вас будет 8640 изображений в день. ~ 15.5 часов Если вы делаете 3 изображения каждые 20 секунд, у вас будет 12 960 изображений в день. ~ 10,3 часов
When should I apply Calibration to my analysis?
To calibrate, or not to calibrate; that is the question. And it’s an important question to ask prior to installing your online bulk material analysis system, regardless of the industry you’re in. Let’s help you figure out why calibration may or may not be your best bet, and whether you will see value in calibrating your system. Одним из недостатков технологии анализа фрагментации горных пород на основе изображений является невозможность анализа нижележащего материала, движущегося по конвейерной ленте. Таким образом, в нормальных условиях без калибровки мелкий материал обычно недостаточно представлен при использовании анализа изображений. То же самое можно сказать и об анализе фрагментации взрыва, но я коснусь этого чуть позже в статье. Если технологии фотоанализа представляют материал на верхнем слое и не представляют нижележащий материал, операция может компенсировать этот недостаток путем калибровки. (Руководство по калибровке можно найти по этой ссылке). The way I see it, without sounding too much like a broken record, calibrated photo analysis technologies take the best of both worlds: Quantity and quality. Take the following scenario as an example: Company ABC wants to adjust the SAG feed based on particle size analysis. By doing so, they need to know when to draw fine material from the stockpile and when to draw coarser material. Calibration allows for the proper “mix” of bulk material in order to optimize the process. The Swebrec and Rosin-Rammler functions are great for adjusting the distribution curve to accurately compensate for fine material… But what if you are looking strictly at the coarse sizes, say, for oversize detection? If this is the case, you may want to reconsider the calibration process. Allow me to explain: A calibrated system is making certain assumptions about material underneath the top layer and may even bias your coarse material fractions when trying to adjust the distribution curve. So, if you are planning on having a conveyor belt shut down if it detects material over x size, you may want to reconsider taking the chance of biasing your results. Instead, an uncalibrated system is going to get you very useful data that will allow you to stop/start/act on out-of-spec readings and optimize your process. What are other reasons why clients don’t calibrate? Когда материал слишком большой, гораздо труднее вручную отобрать образец материала, а это может быть недешево. Эта проблема чаще всего возникает на этапе взрывных работ, когда оптимизация взрывных работ в значительной степени зависит от обнаружения относительных изменений в размере материала. Для анализа после дробления некоторые клиенты обнаруживают износ футеровки по относительному увеличению размера материала, поэтому калибровка не требуется. Таким образом, калибровка, безусловно, находит свое применение в горнодобывающей и агрегатной промышленности, а точнее, когда более мелкие размеры материалов являются необходимой частью затруднительного положения; однако некалиброванные системы по-прежнему очень полезны для оптимизации вашего процесса и отслеживания относительных изменений.
What is WipWare’s warranty policy?
WipWare Inc. provides a one-year limited warranty on all products, including components and software. To offer customers peace of mind, WipWare also offers an annual service contract, which includes exclusive technician service rates, monthly check-ins, extended system warranties, and more. With the purchase of any WipWare photoanalysis product, the warranty covers cross-shipping for any defective product under the WipWare Limited Warranty, ensuring minimal downtime for customers. Полную информацию об ограниченной гарантии WipWare см. здесь.
Как WipWare способствует обучению работе с уникальными продуктами?
WipWare goes above and beyond to ensure that not only customers, but any individual or company who may show interest in a WipWare product has the utmost training and confidence when it comes to utilizing our extensive line of photoanalysis systems. WipWare offers free training to individuals, companies, colleges, and universities interested in learning about our products. We recently conducted on-campus workshops for mining students at Queen’s University (Kingston), Laurentian University (Sudbury), and ÉTS University (Montreal). In addition to in-person sessions, we provide virtual training and have a library of training videos available for easy access. For more information about WipWare training please contact support@wipware.com
For more information about our systems, please visit our YouTube channel.
Мы используем файлы cookie на нашем веб-сайте, чтобы предоставить вам наиболее актуальный опыт, запоминая ваши предпочтения и повторные посещения. Нажимая «Принять», вы соглашаетесь на использование ВСЕХ файлов cookie.
Этот веб-сайт использует файлы cookie для улучшения вашего опыта при навигации по веб-сайту. Из них файлы cookie, которые классифицируются как необходимые, хранятся в вашем браузере, поскольку они необходимы для работы основных функций веб-сайта. Мы также используем сторонние файлы cookie, которые помогают нам анализировать и понимать, как вы используете этот веб-сайт. Эти файлы cookie будут храниться в вашем браузере только с вашего согласия. У вас также есть возможность отказаться от этих файлов cookie. Но отказ от некоторых из этих файлов cookie может повлиять на ваш опыт просмотра.
Необходимые файлы cookie абсолютно необходимы для правильной работы веб-сайта. Эти файлы cookie анонимно обеспечивают базовые функции и функции безопасности веб-сайта.
Cookie-файлы
Продолжительность
Описание
Cookielawinfo-Checbox-Analytics
11 месяцев
Этот файл cookie устанавливается подключаемым модулем GDPR Cookie Consent. Файл cookie используется для хранения согласия пользователя на использование файлов cookie в категории «Аналитика».
Cookielawinfo-Checbox-функционал
11 месяцев
Файл cookie устанавливается в соответствии с GDPR, чтобы записать согласие пользователя на использование файлов cookie в категории «Функциональные».
Cookielawinfo-Checbox-другие
11 месяцев
Этот файл cookie устанавливается подключаемым модулем GDPR Cookie Consent. Файл cookie используется для хранения согласия пользователя на использование файлов cookie в категории «Другое».
Cookielawinfo-checkbox-необходимо
11 месяцев
Этот файл cookie устанавливается подключаемым модулем GDPR Cookie Consent. Файлы cookie используются для хранения согласия пользователя на файлы cookie в категории «Необходимые».
Cookielawinfo-checkbox-performance
11 месяцев
Этот файл cookie устанавливается подключаемым модулем GDPR Cookie Consent. Файл cookie используется для хранения согласия пользователя на использование файлов cookie в категории «Производительность».
View_cookie_policy
11 месяцев
Файл cookie устанавливается плагином GDPR Cookie Consent и используется для хранения информации о том, согласился ли пользователь на использование файлов cookie. Он не хранит никаких личных данных.
Функциональные файлы cookie помогают выполнять определенные функции, такие как совместное использование содержимого веб-сайта в социальных сетях, сбор отзывов и другие сторонние функции.
Файлы cookie производительности используются для понимания и анализа ключевых показателей производительности веб-сайта, что помогает улучшить пользовательский интерфейс для посетителей.
Аналитические файлы cookie используются для понимания того, как посетители взаимодействуют с веб-сайтом. Эти файлы cookie помогают предоставить информацию о таких показателях, как количество посетителей, показатель отказов, источник трафика и т. Д.
Рекламные файлы cookie используются для предоставления посетителям релевантной рекламы и маркетинговых кампаний. Эти файлы cookie отслеживают посетителей на веб-сайтах и собирают информацию для предоставления персонализированной рекламы.