Every operation has a specification they need their material size to be within: Whether it’s ASTM specifications for aggregate operations, key performance indicators for crushers and SAGs, or blast metrics for explosives selection, these standards are crucial in streamlining an operation’s process.
For example: an operation in northern Quebec, Canada (if you are looking at a map of Quebec, chances are you are still not looking north enough… keep going… there you go) needed to ensure material size did not exceed 6 inches in size coming out of the primary crusher, for a variety of reasons:
L'energia richiesta a valle per abbattere queste grandi particelle era significativa
Problemi di manutenzione in termini di danni causati da queste particelle sovradimensionate
Getting maintenance personnel on-site to deal with the points was extremely costly
With the assistance of Xstrata Process Support (XPS) and a hydraulic toggle supplier, WipWare was able to not only identify when material was larger than 6″ but send signals to through a PLC that would automatically adjust the crusher mantle to bring the material size back in line. Just by reducing maintenance shutdowns to manually adjust the crusher setting, this operation was able to recoup the cost of the system within a year.
Even if your operation opts to manually adjust its process using WipWare’s systems as a guide, the benefits are widespread and significant. We’ve seen the timeline between liner replacements expanded drastically, and SAG feed optimized on-the-fly by utilizing online data as a standard.
…And for the folks who have dealt with paving specifications, all it takes is for a half mile of out-of-spec pavement to be pulled up to identify the importance of keeping material in between the goal posts.
Speaking more on the ground level of photoanalysis technology, envelopes can be created inside of WipFrag e Assolo, so operators can identify out-of-spec material briefly. Perhaps it’s a matter of notifying mining personnel, or shutting down a belt until liner maintenance is completed; regardless, having a tool that can help significantly in adhering to your operation’s standards can mean cost-savings, reduced downtime, and a more proactive approach to mining and milling.
WipWare has been in the image analysis business for over 30 years commercially. We’ve seen a wide range of mining and aggregate sites, all with their unique challenges. One thing that stays consistent with every operation is the need to reduce particle sizes to ideal sizes for either the extraction of minerals, or for more practical uses (road building, etc.)
Blasting, crushing and grinding material down to an optimal size is difficult to do. When you tie in trying to be efficient at the same time, production rates can fluctuate quite easily. It’s very hard to track how well the ‘rock breaking’ is going.
Setacciatura della coda!
La setacciatura manuale esiste da migliaia di anni. Al giorno d'oggi, l'accuratezza di questi metodi di analisi del setaccio è piuttosto impressionante: ferma la cintura, fai un taglio, porta il materiale in laboratorio, mettilo nel setaccio e voilà! In poche ore hai il tuo risultato. Cosa potrebbe esserci di meglio?
Well, let’s back it up a little and investigate. Manual sieve samples are very accurate for the sample itself. However, if you use manual sampling to track, say, relative changes, you are putting a lot of faith in that one belt cut of material representing hundreds/thousands of tons of material.
Manual Sieving vs Continuous Monitoring
You may notice why WipWare systems are really taking a hold in the mining and aggregate industries: No one will ever argue that a manually sieving a sample is not accurate; but here is a scenario I want you to consider:
You take a sample of a 1-meter belt cut every shift for analysis. When the crusher supplier asks for the material size going into the secondary crusher, you hand him/her the beautiful distribution curves with the data points in the Excel file. Based on the data, he/she decides “based on your material size, you need this kind of crusher/liner/product”.
Do those manual samples accurately represent the hundreds or thousands of tons passing through your process? What if the sample you took happened to be finer than what was typical? Chances are, as granulometry guru Jack Eloranta, of Eloranta & Associates calculates, misrepresentation could be possible.
Take a look:
Assumere:
400 TPH
6 m/s
Campione di nastro da 1 metro per turno
La cintura percorre 1 metro in 0,17 secondi
0,17 sec x 1 ora/3600 sec x 400 t/ora = 0,019 tonnellate
.019 t/(8 x 400) t = .0000059
Really, when you look at how representative a manual sample is, you are looking at 0.00059% of your conveyor material in this example.
With a percentage like that, I’ll take continuous, non-disruptive particle sizing any day.
So let’s summarize so far: Manual sieving accurately measures the sampled material but may not represent the material continuously running through your process.
What’s WipWare’s role in all of this?
Well, it’s really a complementary thing. WipWare is the ying to sieving’s yang, the Sunny to sieving’s Cher…I’ll stop now.
WipWare’s systems offer continuous monitoring of material. That’s right. 24/7/365 analysis of the most important part of the mining process; the whole reason billions upon billions of dollars are spent each year; the reason why mine and mill employees have a love/hate relationship – the size of material! Manual sieve results can be tied into the WipWare data using Rosin-Rammler or Swebrec functions, covering both the quantity of data needed for accurate analysis, with the quality manual sample information.
WipWare’s systems offer continuous monitoring of material. That’s right. 24/7/365 analysis of the most important part of the mining process; the whole reason billions upon billions of dollars are spent each year; the reason why mine and mill employees have a love/hate relationship – the size of material! Manual sieve results can be tied into the WipWare data using Rosin-Rammler or Swebrec functions, covering both the quantity of data needed for accurate analysis, with the quality manual sample information.
Riflesso
Evaluating Rock Comminution Pre-Blast to Post-Blast and Through Mineral Processing
The Need for Energy Efficiency Assessment in Blasting
In today’s mining and quarrying operations, energy efficiency remains one of the most pressing challenges. Blasting, being the first step in the comminution process, consumes a significant portion of total energy in mineral production. Yet, the true measure of blasting efficiency is not merely how rock is broken, but how well the resulting fragmentation supports downstream processes such as crushing and grinding.
A tool is therefore needed to assess and quantify the energy utilization in blasting, specifically through fragmentation analysis. By analyzing fragmented rock sizes in terms of percentage passing, engineers can evaluate how effectively a particular blast design converted explosive energy into rock breakage. Since controllable parameters such as burden, spacing, charge distribution, and initiation timing govern how explosive energy is distributed within the rock mass, understanding fragmentation helps determine how these parameters interact with uncontrollable factors like rock structure and discontinuities.
WipWare: The Global Ruler for Rock Size Assessment
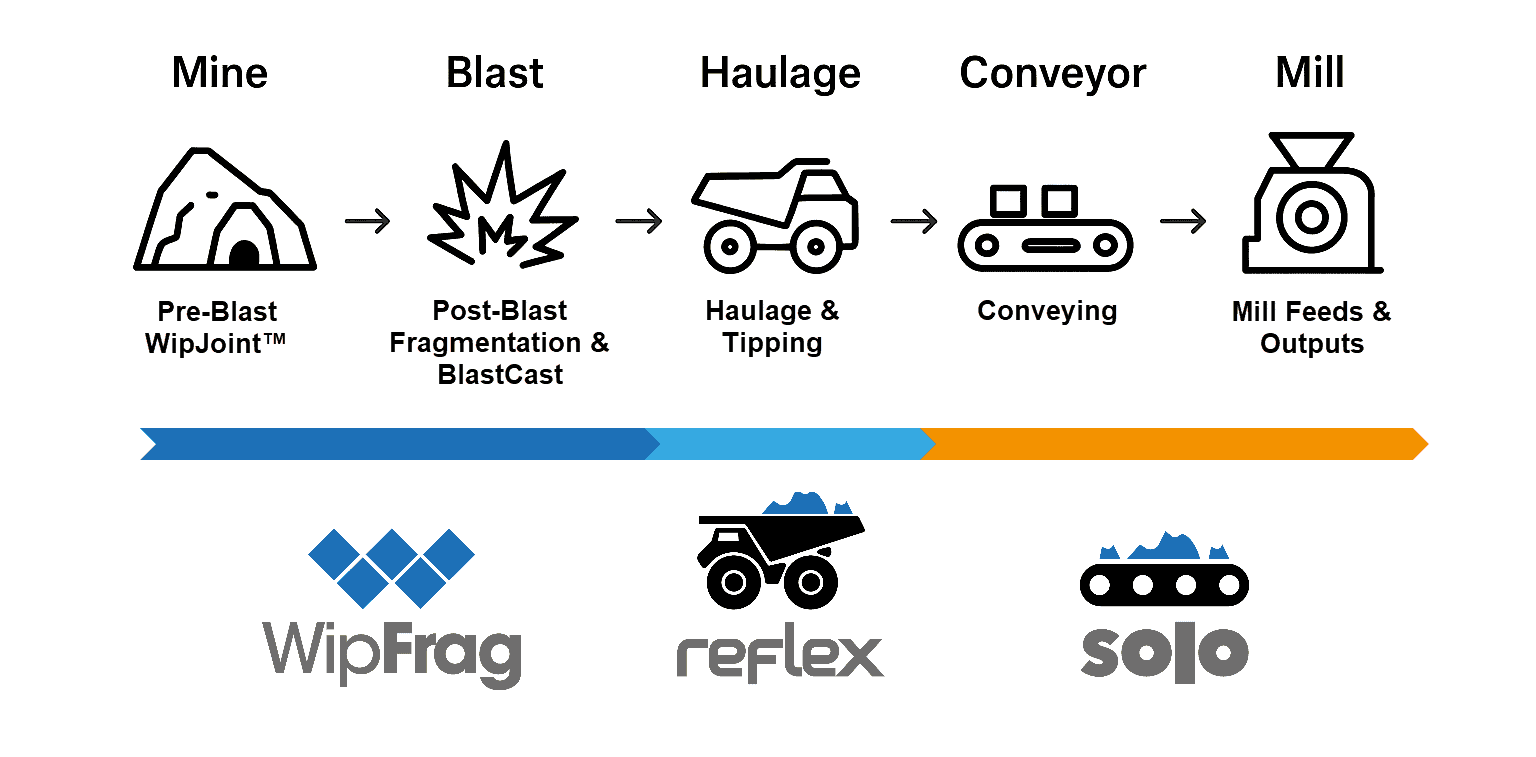
WipWare Inc. is well known as the world leader in rock size measurement and fragmentation analysis. Known as the ruler for rock size assessment, WipWare provides innovative tools that quantify particle size distributions (PSD) from pre-blast through post-blast and into mineral processing stages, creating a continuous feedback loop for process optimization.
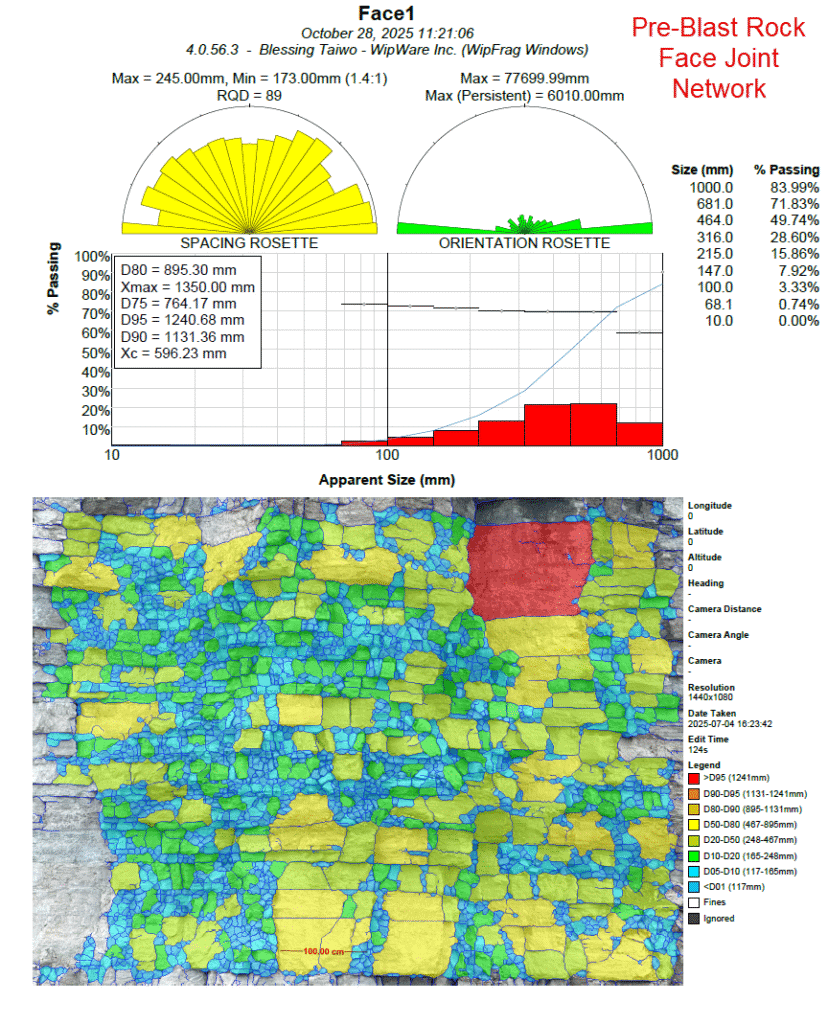
Pre-Blast Assessment with WipJoint
Understanding the geological conditions before blasting is crucial for predicting fragmentation outcomes. To bridge the gap between rock mass discontinuity and fragmentation potential, WipWare re-introduced WipJoint, a technology developed in 1990 by Dr. Norbert Maerz, Dr. John Franklin, and Dr. Tom Palangio.
WipJoint enables users to assess rock joint apparent spacing, apparent orientation, RQD and apparent in-situ block size from digital images of rock faces. This pre-blast information is invaluable for correlating structural conditions with post-blast fragmentation results. By analyzing joint characteristics, mining engineers can refine their blast design to ensure optimal energy distribution within the rock mass, thereby improving fragmentation and reducing energy waste in subsequent comminution stages.
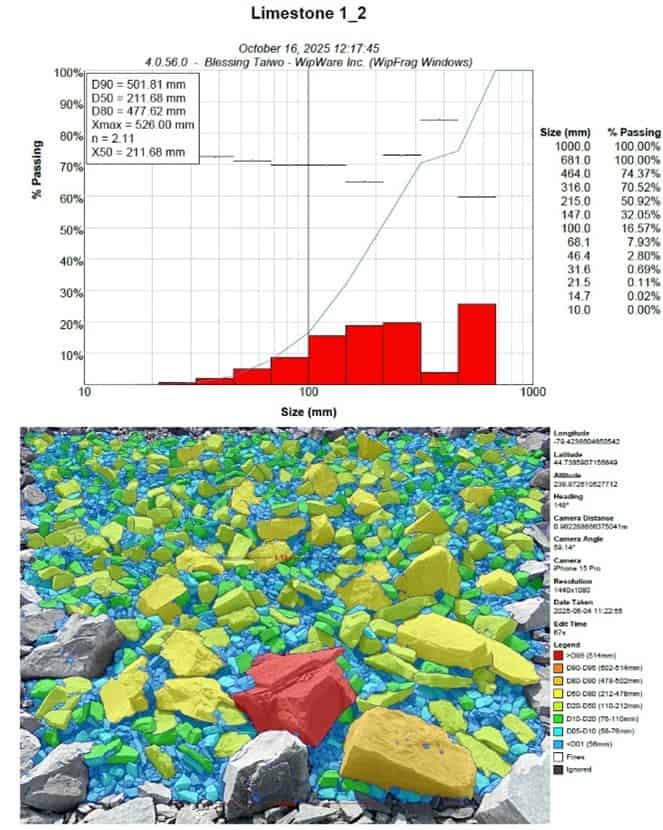
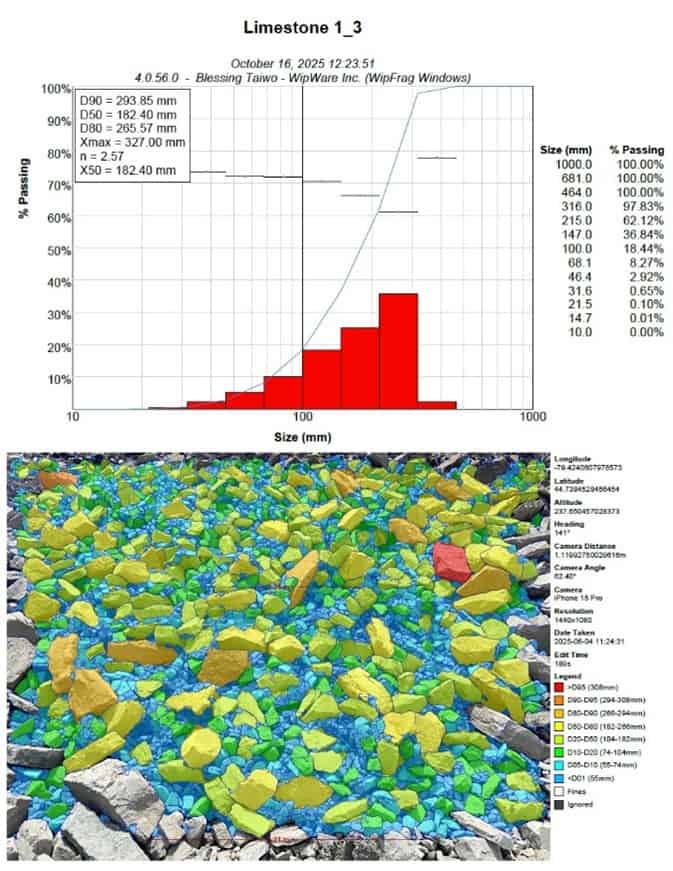
Post-Blast Fragmentation Analysis with WipFrag
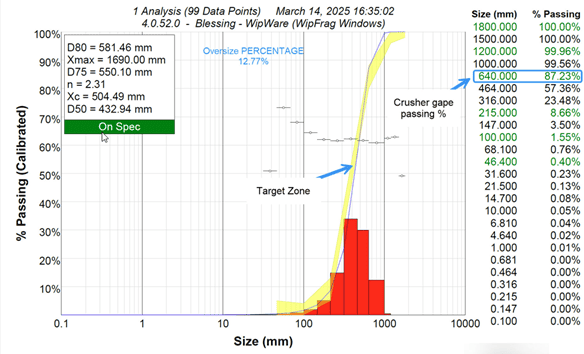
Once blasting is completed, WipFrag provides the most reliable and efficient means for evaluating fragmentation results. Using advanced image analysis, WipFrag calculates the particle size distribution (PSD) of fragmented rock piles and compares the results to target sizes such as the primary crusher’s gape.
This capability allows for quantitative comparison between different blast designs, helping to identify which parameters yield the best fragmentation for energy efficiency and crusher compatibility. With tools like specification envelopes and boulder detection, WipFrag makes it possible to assess whether the blast produced the desired material size and shape for downstream processes.
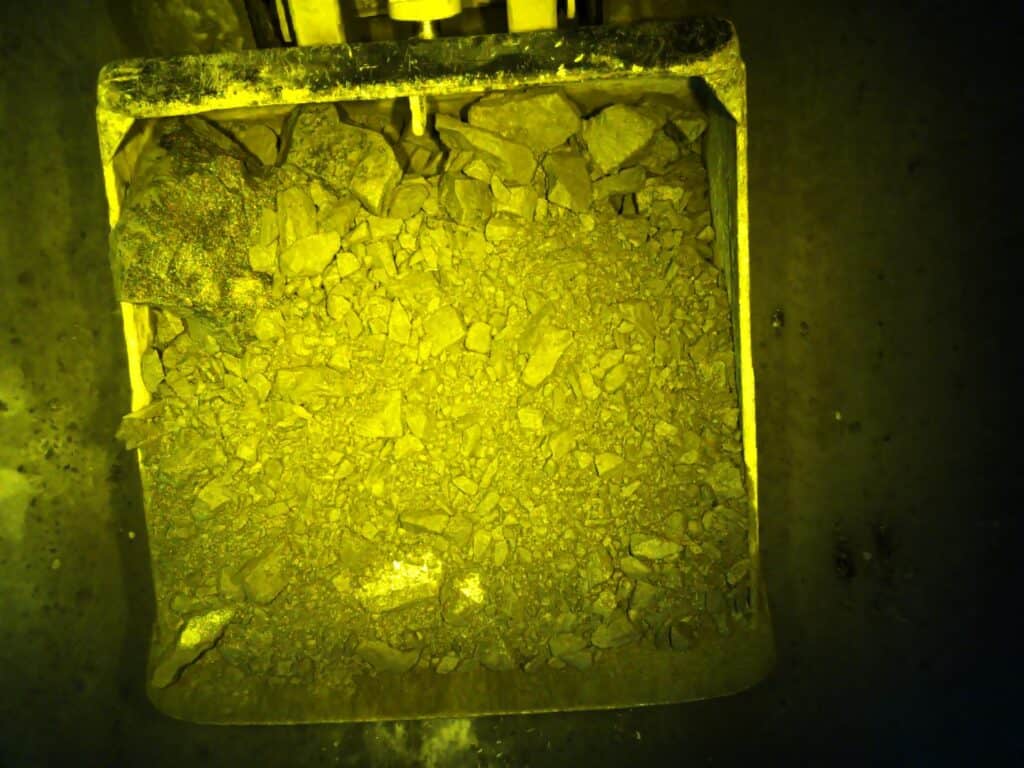
Material Assessment During Haulage with Reflex 6
Fragmentation control doesn’t stop at the muck pile. During haulage, WipWare’s Riflesso extends analysis to every truckload of material. Equipped with high-resolution cameras and an onboard computer, Reflex captures real-time images of material in transit, either while loaded on the truck or when being dumped at the crusher hopper or stockpile.
This technology enables continuous monitoring of material quality from each blast bench, providing operators with valuable data on fragmentation size, shape, uniformity and ore type variation. The Reflex system thus acts as vehicle load assessment platform, ensuring that no load goes unanalyzed.
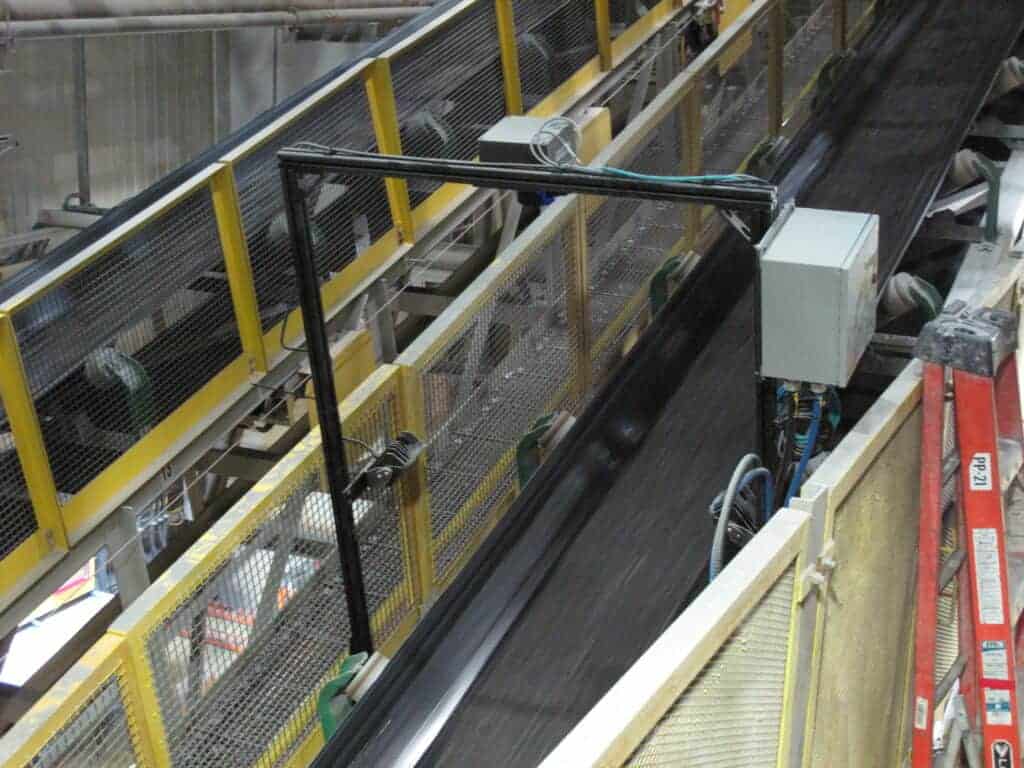
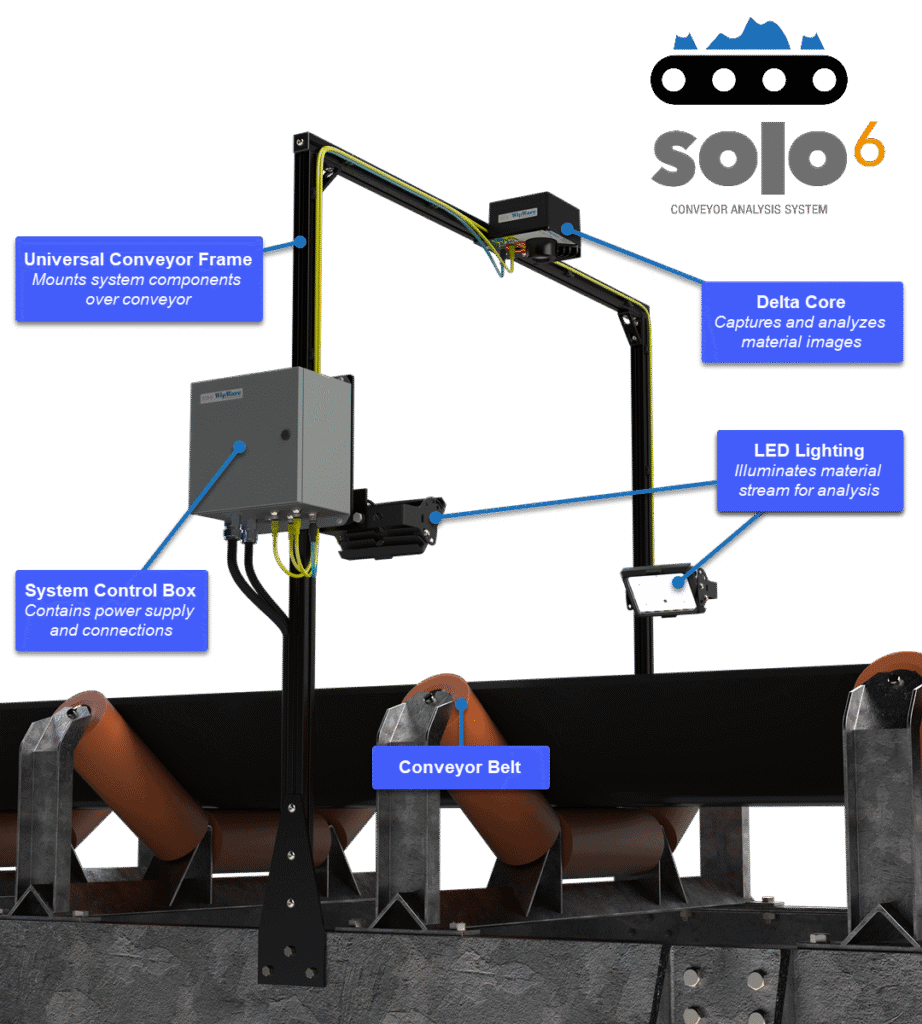
Conveyor Belt Monitoring and Process Optimization with Solo 6
At the mineral processing stage, WipWare Assolo revolutionizes comminution monitoring. Installed over conveyor belts, Solo continuously analyzes the size distribution of material feeding the crusher or exiting as product. This intelligent system provides live feedback to operators, empowering them to make real-time decisions for process optimization.
Solo integrates seamlessly with existing process control systems such as Modbus TCP and OPC UA, allowing direct communication with plant control networks. This enables automatic crusher gap adjustment, SAG mill feed control, and load balancing, ensuring that the plant operates within optimal limits.
By maintaining consistent feed size and adjusting operational parameters accordingly, Solo helps minimize bearing pressure, reduce liner wear, improve throughput, and enhance overall energy efficiency throughout the comminution circuit.
WipWare technology provides a fully integrated suite of solutions that cover every stage of the comminution chain, from pre-blast geological assessment (WipJoint), through post-blast fragmentation evaluation (WipFrag), haulage assessment (Reflex), and processing control (Solo). By quantifying and connecting each step, WipWare enables mines to measure, monitor, and optimize energy use across the entire operation. The result is smarter blasting, improved crusher efficiency, and a more sustainable approach to mineral processing, achieving the ultimate goal of energy-efficient comminution.
Mine-to-Crusher Application of WipWare Solutions: Case Study at dstgroup Quarry
This study presents the third phase of a three-part research series focused on optimizing the interface between blasting and primary crushing operations at dstgroup aggregate quarry in Portugal, using WipWare solutions. The central goal is to improve fragmentation outcomes to better align particle size distribution (PSD) with crusher requirements, thereby reducing energy consumption and enhancing operational efficiency.
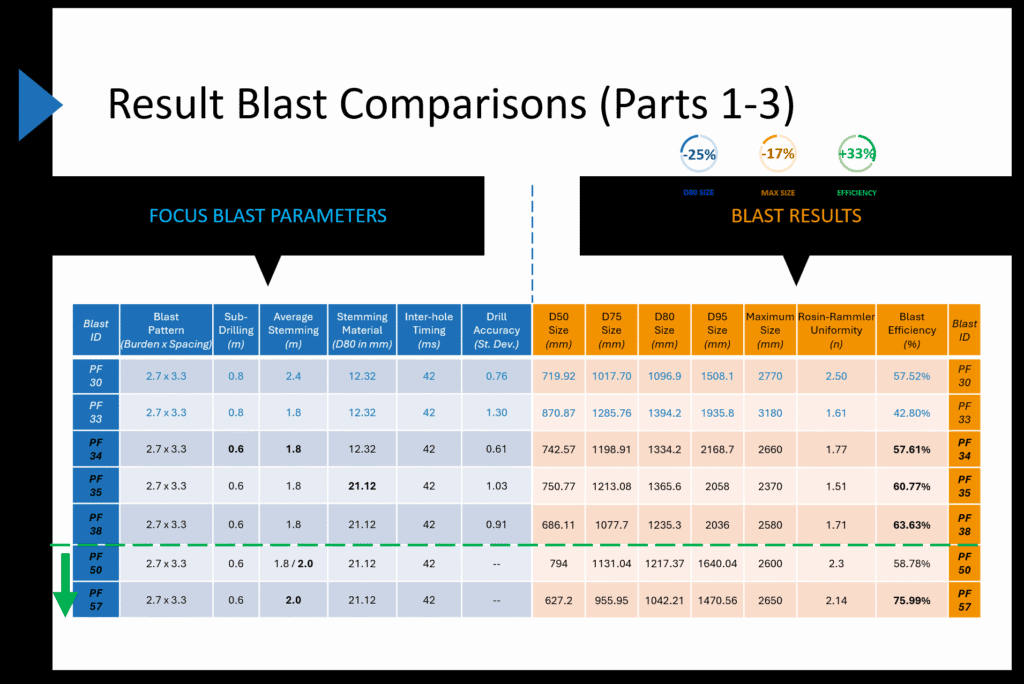
Building on the baseline methodology developed in Part 1, which incorporated 3D bench modeling and borehole surveys to assess blast compatibility with crusher specifications, the study identified discrepancies between predicted and actual fragmentation results. Part 2 applied targeted adjustments, such as reducing subdrill depth and altering stemming material, achieving measurable improvements in D80, maximum fragment size, and overall blast efficiency. However, boulder formation persisted in certain blast rows, prompting further optimization.
In this phase, the team implemented remaining recommendations, including refined drill and blast patterns, increased stemming size (from D80 12 mm to 21 mm) and length (from 1.8 m to 2 m), improved drilling accuracy, and adjusted inter-hole timing. High-resolution drone imagery and point-by-point blast surveys were integrated into O-PitSurface simulations to evaluate blast performance. WipFrag software was utilized for detailed particle size analysis, enabling comparison of fragmentation outcomes before and after design modifications.
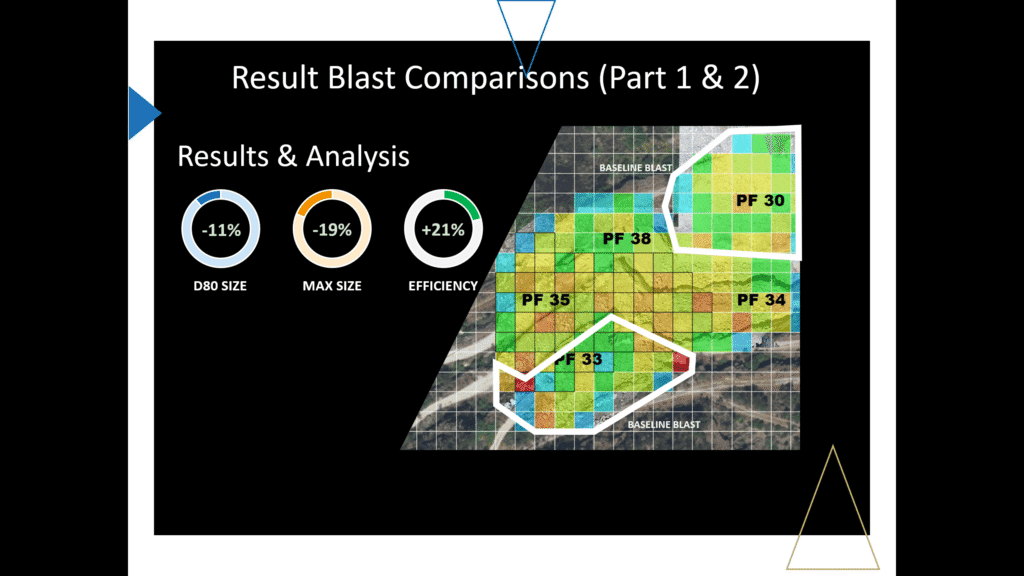
Results demonstrated significant gains: D50 decreased by 19%, D80 and D95 by 20% and 23%, respectively, and maximum particle size reduced by 3%, indicating better control over oversized material. Fragmentation efficiency improved by over 21%, and the uniformity index increased by 16%, reflecting more consistent and predictable PSD. Adjustments to stemming material and length enhanced energy confinement, minimizing premature blowout and promoting even energy distribution throughout the blast column.
Run-of-mine monitoring with the Reflex system above the primary crusher provided real-time PSD analysis, confirming continuous improvement in fragmentation and crusher feed consistency. Over a six-month period, key size distribution metrics consistently trended downward, validating the effectiveness of iterative blast parameter adjustments and demonstrating the value of data-driven, integrated mine-to-crusher strategies.
In conclusion, the study illustrates how WipWare solutions, including WipFrag, Reflex, and O-PitSurface, enable quarry operations to optimize fragmentation, reduce oversize and fines, improve crusher compatibility, and enhance overall operational efficiency. The mine-to-crusher framework serves as a replicable model for energy-efficient, predictable, and high-performance blast-to-crusher integration.
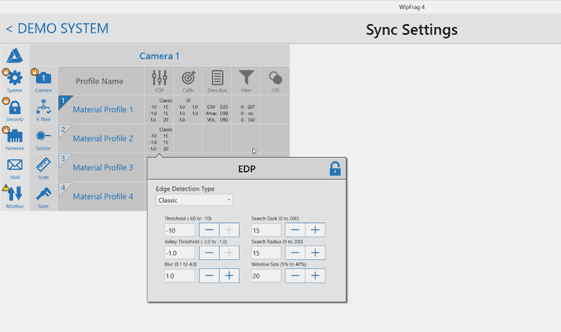
Quali parametri di rilevamento dei bordi (EDP) dovrei usare?
Quando si utilizza WipFrag per analizzare le pile di letame, è possibile utilizzare le seguenti linee guida:
Multe = Cursori a destra
Medio = Cursori nel mezzo
Large = Cursori a sinistra
Generally, you want to have accurate nets on the small- to medium-sized particles. Once you find a suitable net for this size of material you can manually edit the larger material. Using this method will help provide more accurate results.
It’s also recommended that you try to keep a similar EDP for images of the same muck pile, or when trying to compare different muck piles.
If finer adjustments are required, you can activate the ‘Show Advanced Controls’ checkbox to access numeric inputs featuring a wider range of finer adjustments than the basic sliders provide.
WipWare Automated Photoanalysis Systems and EDP
In Delta, una versione avanzata del software WipFrag che funziona sui sistemi di fotoanalisi automatizzata WipWare, utilizziamo un processo chiamato Best Fit EDP. Per i sistemi online, questo processo viene solitamente eseguito in loco al momento dell'installazione. Viene implementato prendendo un'immagine di materiale tipico una volta che tutte le impostazioni hardware e software sono state completate. Tracciamo manualmente il maggior numero possibile di particelle e quindi eseguiamo la funzione Best Fit EDP. Il software cercherà quindi di abbinare la traccia manuale delle particelle utilizzando le impostazioni EDP disponibili. Best Fit EDP emette una serie di valori numerici che verranno inseriti nei controlli avanzati EDP. Questo metodo è molto accurato e fornisce ai nostri sistemi online parametri di rilevamento dei bordi adatti. È raro che un sistema EDP online debba essere modificato, ma in tal caso è possibile farlo in remoto dalla nostra sede.
Best Fit EDP was recently added to WipFrag software. Because of the time involved in editing an image to produce a good Best Fit EDP, this feature is most practical to reduce the amount of manual editing required if you are going to be analyzing many images (20, 30 or more) of the same material under the same conditions. For most users, where smaller batches tend to be analyzed at once, using the sliders to adjust the EDP is faster.
Within WipFrag, there is also a feature called Auto EDP which attempts to determine the edge detection parameters automatically. This feature works well if the particle size range is narrow.
Non conosci la tecnologia della fotoanalisi? Forse hai un'installazione e vorresti esaminare altre posizioni per migliorare l'efficienza? Continua a leggere oltre il salto per alcune delle posizioni più popolari di WipWare.
Where would be an ideal location to install your technologies?
There are 5 main locations where photoanalysis technologies are installed, all of which have a similar theme of analyzing material after it has been reduced in size. I’ve listed a few (of the many) popular locations, from the mine to the mill:
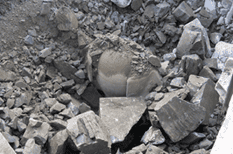
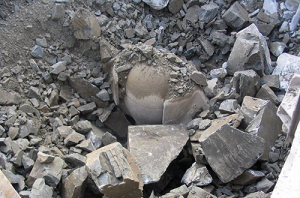
Blast Fragmentation
Unlike conveyor belt technologies, blast fragmentation systems are providing particle sizing data that would otherwise be unquantifiable. As an example: When mine team is asked how they were determining blast performance, they responded with: “Well, we try to compare it just by looking at it”. By putting quantifiable values beside the material being dumped into the primary crusher, we eliminate any bias and baseline the blasting performance.
Now, think for a second how much cheaper it would be, if you could do most of your material breaking in the blasting phase: Reduced crusher needs, less maintenance on equipment, and significantly reduced energy costs to name a few of the benefits of optimizing blasting procedures.
Post-primary/Post-secondary crusher
Either Jaw, Gyratory, or Cone, whatever type of crusher you use to break down your material, if it’s primary, secondary or tertiary crushing, you should be looking into evaluating the performance of those crushers, in order to a) maximize liner life, b) make crusher gap adjustments, c) change worn out liners before oversize contaminates your stockpile, d) improve overall crusher throughput.
See, most crusher maintenance schedules are based on a fixed timeline, when many variables can affect the lifetime of the liners. Think ore hardness, size, etc.
In effetti, tornando a un precedente post sul blog, puoi effettivamente iniziare ad automatizzare quella parte del tuo processo per la massima efficienza.
Screen Breakages
Se hai bisogno di una rottura immediata dello schermo o di indicatori di usura, le tecnologie di fotoanalisi possono rilevare molto bene il materiale fuori misura dopo lo screening. I produttori di aggregati, ad esempio, vedono un valore significativo nell'identificare materiale fuori specifica immediatamente dopo che è stato identificato un guasto dello schermo.
SAG Optimization
This is probably the location with the biggest potential return on investment, and is the most common first installation: Imagine controlling your stockpile blend based on continuous particle sizing information. Being able to optimize SAG feed can save an operation significant cost in a variety of areas.
Sapere quando nutrirsi dai lati più grossolani della riserva o dal centro.
One of the most common questions we receive is, “How small can you analyze?” The answer depends on multiple factors, but with the right imaging, WipWare’s systems can measure down to micron levels. However, when analyzing material on conveyor belts, additional considerations impact the minimum particle size that can be accurately measured.
Over the years, we’ve worked with a vast range of conveyor belt applications from highly quality-controlled 10-inch belts to massive run-of-mine conveyors that are several metres wide as is normally found in global copper, iron ore mine operations. Our fully adjustable frames are customized before shipping to ensure seamless integration into your operation.
Key Considerations for Conveyor Belt Analysis
When it comes to analyzing material on conveyor belts, a few fundamental factors come into play:
Fixed Camera Position – The camera is mounted at a consistent distance from the belt, usually within a metre or so (a few feet).
Controlled Lighting – Conveyor belt environments generally offer stable lighting conditions, improving image accuracy.
Material Spread – The material stream typically covers a predictable portion of the belt rather than the entire conveyor surface, allowing the camera to focus specifically on the material.
Controlled Flow – Conveyed material has a known source and destination and moves at a controlled speed and direction, making variables easier to control.
With these stable conditions, WipWare’s systems can precisely determine the size ranges they analyze for each application.
Real-World Examples
Let’s explore two real-world examples using WipWare’s Assolo system:
Azienda
ABC Company
XYZ Company
Material Type
Copper
Gold
Conveyor Dimensions
3 metres / 10 feet
1.2 metres / 4 feet
Analysis Location
Primary crusher output
SAG mill feed
Detectable Sizes
7.14 mm – 609.6 mm 0.2812 in (~#3) – 24 in
2.86 mm – 243.84 mm 0.1125 in (~#7) – 9.6 in
From the comparison table above, we see that ABC Company’s larger conveyor widths require the particle sizing system to be mounted higher to capture the full material spread. This setup means the system focuses more on coarser size fractions than fines – which is good: If a 3-metre belt is in use, and the material is raw primary crusher output, it’s unlikely that the material is 100% fines.
In contrast, Company XYZ deals with crushed and pre-screened materials, meaning the belt carries smaller particles. Since the conveyor is smaller in width, the system mounting height is closer to the material and can therefore analyze smaller size fractions.
Note: These are real-world examples with their own unique challenges which affect the detectable size range and goals which determine the focus of data collection. Your own application could have very different detectable size ranges depending on similar factors at your operation.
Expanding the Size Range: What are the options?
If you need to adjust the minimum or maximum detectable particle size, consider the following:
Calibrate for Unseen Fines – Using sieve data and manual belt cuts to measure unseen and unresolvable fines and calibrate the system output accordingly. This is good for known and predictable material streams.
Reduce the Field of View – Narrowing the system’s focus by adjusting the position or changing the type of lens used to view a smaller area. This in turn may limit the ability to capture coarser sizes.
Increase Camera Locations – Using multiple cameras on the same material stream to capture different ranges of material, ie. a “fines” camera and a “coarse” camera.
Tailored Solutions for Your Operation – The technology itself can change for your specific needs, such as increasing the camera resolution or changing the mounting solution.
If you’re wondering how effective a WipWare analysis system would be for your operation, Contattaci! Our technologies have helped mining operations worldwide achieve better process control.
Have a unique application? We love a challenge — send us the details, and we’ll be happy to assist!
Utilizziamo i cookie sul nostro sito Web per offrirti l'esperienza più pertinente ricordando le tue preferenze e ripetendo le visite. Cliccando su "Accetta", acconsenti all'uso di TUTTI i cookie.
Questo sito Web utilizza i cookie per migliorare la tua esperienza durante la navigazione nel sito Web. Di questi, i cookie classificati come necessari vengono memorizzati nel browser in quanto sono essenziali per il funzionamento delle funzionalità di base del sito Web. Utilizziamo anche cookie di terze parti che ci aiutano ad analizzare e capire come utilizzi questo sito web. Questi cookie verranno memorizzati nel tuo browser solo con il tuo consenso. Hai anche la possibilità di disattivare questi cookie. Ma la disattivazione di alcuni di questi cookie potrebbe influire sulla tua esperienza di navigazione.
I cookie necessari sono assolutamente essenziali per il corretto funzionamento del sito web. Questi cookie garantiscono funzionalità di base e caratteristiche di sicurezza del sito web, in modo anonimo.
Cookie
Durata
Descrizione
cookielawinfo-checbox-analytics
11 mesi
Questo cookie è impostato dal plug-in di consenso sui cookie GDPR. Il cookie viene utilizzato per memorizzare il consenso dell'utente per i cookie nella categoria "Analytics".
cookielawinfo-checbox-funzionale
11 mesi
Il cookie è impostato dal consenso cookie GDPR per registrare il consenso dell'utente per i cookie nella categoria "Funzionali".
cookielawinfo-checbox-others
11 mesi
Questo cookie è impostato dal plug-in di consenso sui cookie GDPR. Il cookie viene utilizzato per memorizzare il consenso dell'utente per i cookie nella categoria "Altro.
cookielawinfo-checkbox-required
11 mesi
Questo cookie è impostato dal plug-in di consenso sui cookie GDPR. Il cookie viene utilizzato per memorizzare il consenso dell'utente per i cookie nella categoria "Necessario".
cookielawinfo-checkbox-performance
11 mesi
Questo cookie è impostato dal plug-in di consenso sui cookie GDPR. Il cookie viene utilizzato per memorizzare il consenso dell'utente per i cookie nella categoria "Prestazioni".
viewed_cookie_policy
11 mesi
Il cookie è impostato dal plug-in GDPR Cookie Consent e viene utilizzato per memorizzare se l'utente ha acconsentito o meno all'uso dei cookie. Non memorizza alcun dato personale.
I cookie funzionali aiutano a eseguire determinate funzionalità come la condivisione del contenuto del sito Web su piattaforme di social media, la raccolta di feedback e altre funzionalità di terze parti.
I cookie sulle prestazioni vengono utilizzati per comprendere e analizzare gli indici di prestazioni chiave del sito Web che aiutano a fornire una migliore esperienza utente per i visitatori.
I cookie analitici vengono utilizzati per capire come i visitatori interagiscono con il sito web. Questi cookie aiutano a fornire informazioni sulle metriche del numero di visitatori, frequenza di rimbalzo, sorgente di traffico, ecc.
I cookie pubblicitari vengono utilizzati per fornire ai visitatori annunci e campagne di marketing pertinenti. Questi cookie tracciano i visitatori sui siti Web e raccolgono informazioni per fornire annunci personalizzati.