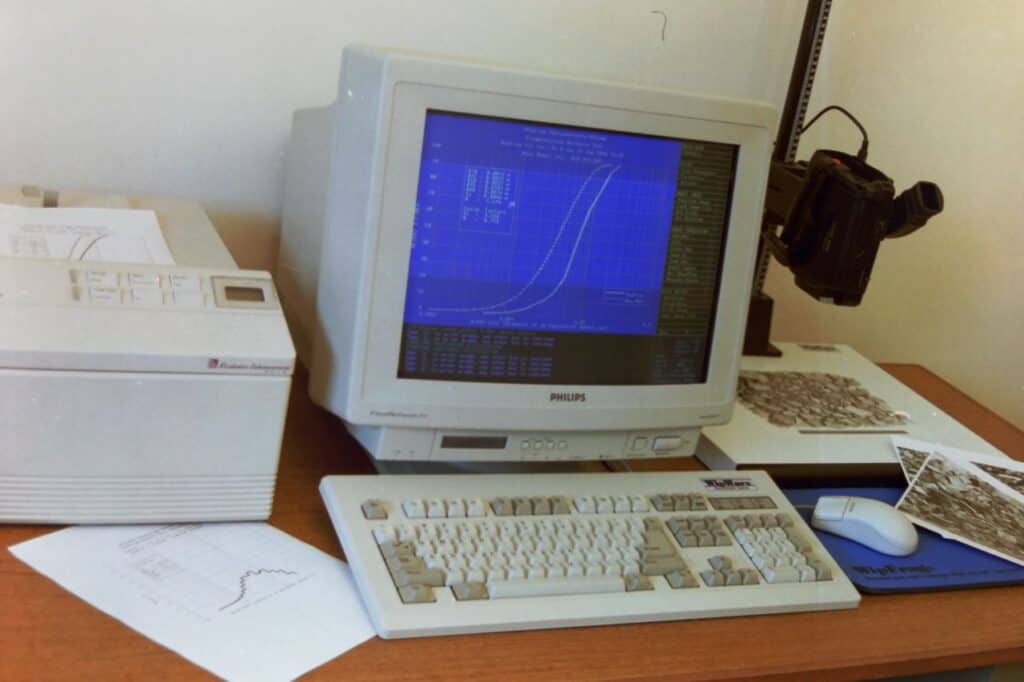
From a dusty DOS computer to AI-powered, real-time fragmentation analysis systems… WipWare has been at the forefront of fragmentation analysis for over 30 years of innovation, transforming how the world measures particle size.
The Beginning
From humble beginnings to global impact, we’ve come a long way. This year, we’re celebrating over 30 years of innovation in fragmentation analysis. Along the way, we’re taking a look back at the milestones. These milestones shaped us and the journey of making particle size analysis smarter, faster, and easier than ever.
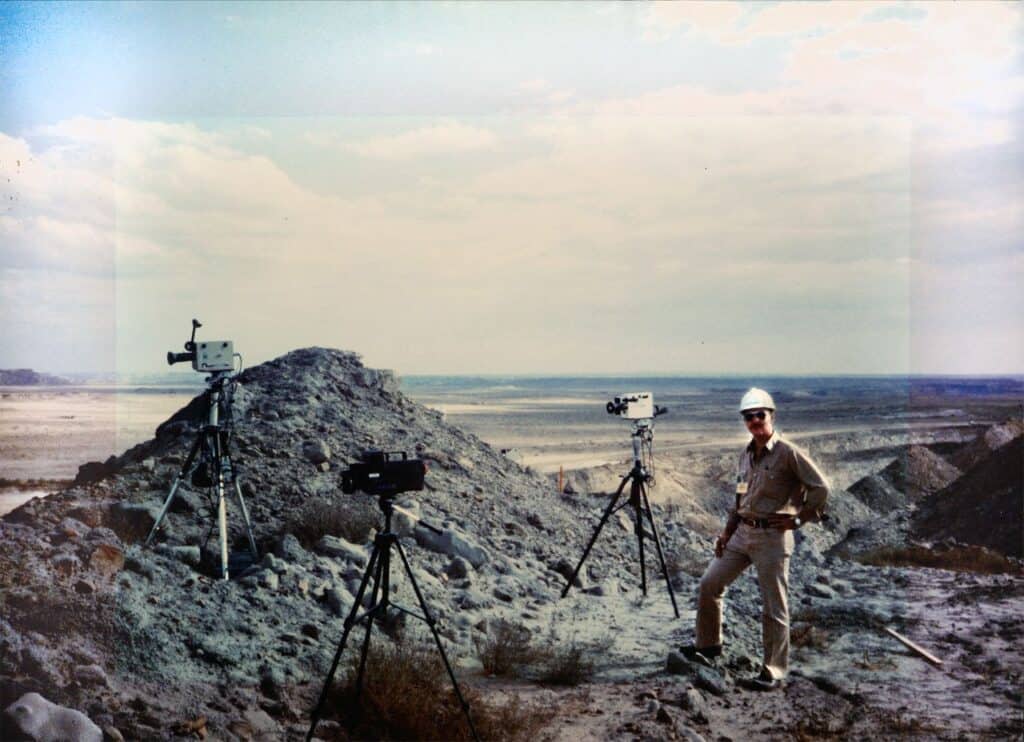
Before WipWare was WipWare, our founder Том Палангио was in the field with North Bay DuPont. He was tackling real-world challenges with innovative thinking and a practical mindset.
Below is a photo of Tom from our archives. He was working on a project that would spark the idea for our very first product in fragmentation analysis: WipFrag.
Solving a Global Problem
Traditionally, describing blast results in mines and quarries was limited to vague terms like “good,” “fair,” or “poor.” Manual sieving and particle counting were too costly and impractical until a team of passionate pioneers changed the game.
WipFrag was born in 1986 from groundbreaking collaboration between Franklin Geotechnical, DuPont/ETI, and the University of Waterloo. It was the world’s first digital image analysis software for measuring rock fragmentation.
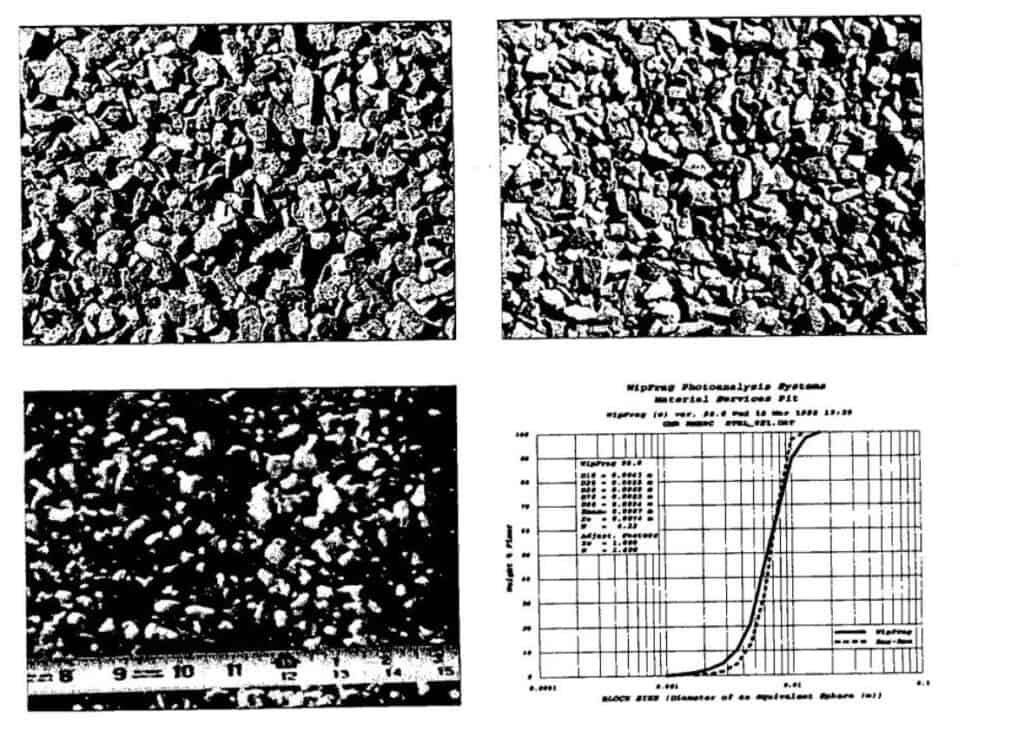
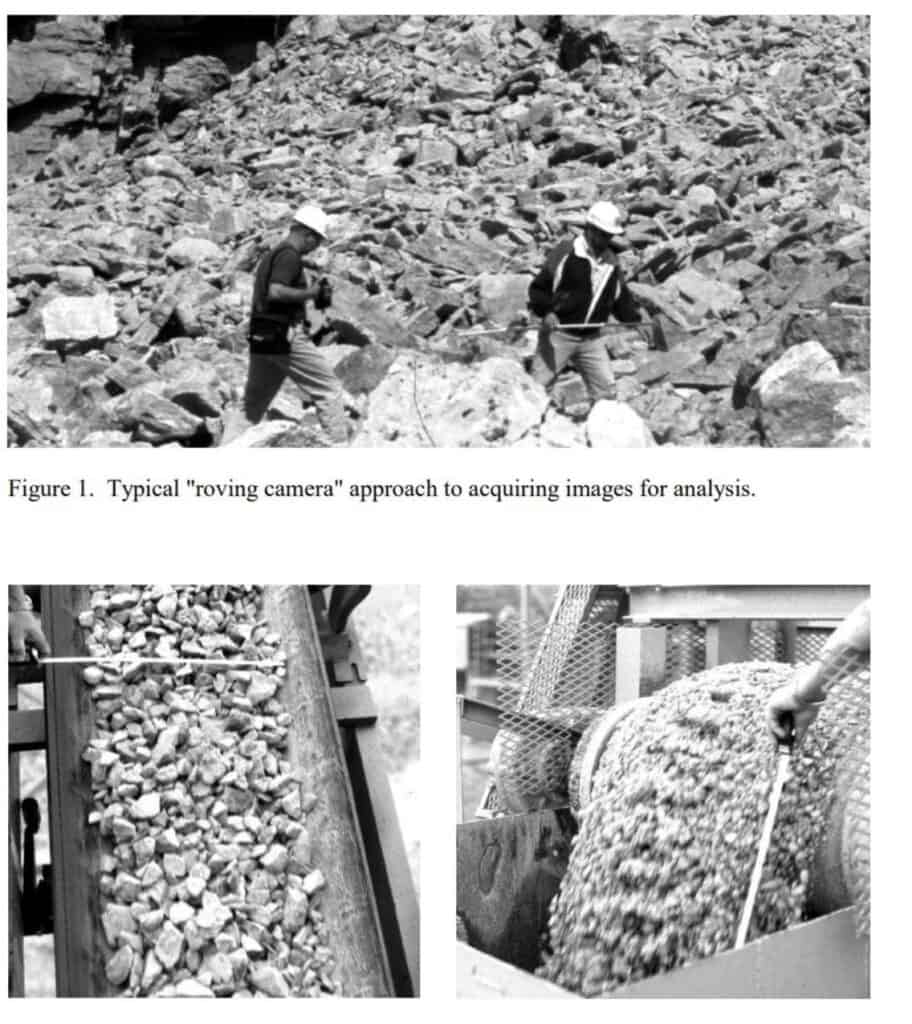
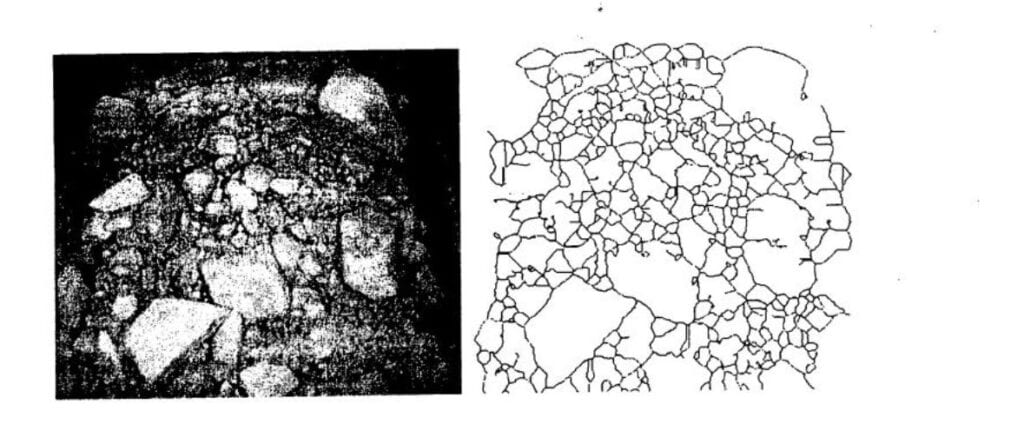
Leveraging advancements in imaging and computer processing, they created a revolutionary tool. A digital method to analyze muckpile photos or video frames to produce a detailed fragmentation size distribution curve.
The name itself carries the legacy: Waterloo Image Enhancement Process for Fragmentation or “WIEP,” later shortened to just “WipFrag.”
Since then, our journey has been marked by bold ideas, hard-earned field experience, and a commitment to excellence that has brought us to where we are today. Том Палангио, with his explosive expertise, innovative leadership, and close collaboration with Dr. Norbert Maerz and Dr. John Franklin laid the groundwork for much of what we now take for granted in automated material analysis.
First Trials
Thanks to real-world testing in 1980s-1990s at INCO’s Copper Cliff and Coleman underground operations and Highland Valley Copper in BC, WipFrag proved its worth boosting productivity, reducing oversize, and optimizing blast patterns. Results included a 40% pattern expansion and 10% increase in mill throughput milestones that cemented WipFrag’s value in the mining industry.

We owe this innovation to the visionaries who asked, “What if we could measure fragmentation automatically?” and then made it possible. Hats off to the original developers and researchers whose dedication paved the way for what WipWare is today, 30 years strong and still leading the future of photoanalysis technology.
WipJoint and System 1
In 1990, WipJoint was introduced for measuring in-situ rock apparent block size and joint orientation.
Our journey into real-time automated analysis systems began in 1998, led by Thomas W. Palangio, the founder’s son, as he joined the company and introduced our first hardware systems. System 1 was released in 1998 with one camera for online analysis: a well-received innovation for the mining industry. The very next year, System 2 was rolled out, boasting the capacity to integrate 12 cameras for real-time analysis.
Then another year later in 2000, WipFrag 2 was developed, building on the success of the first WipFrag.
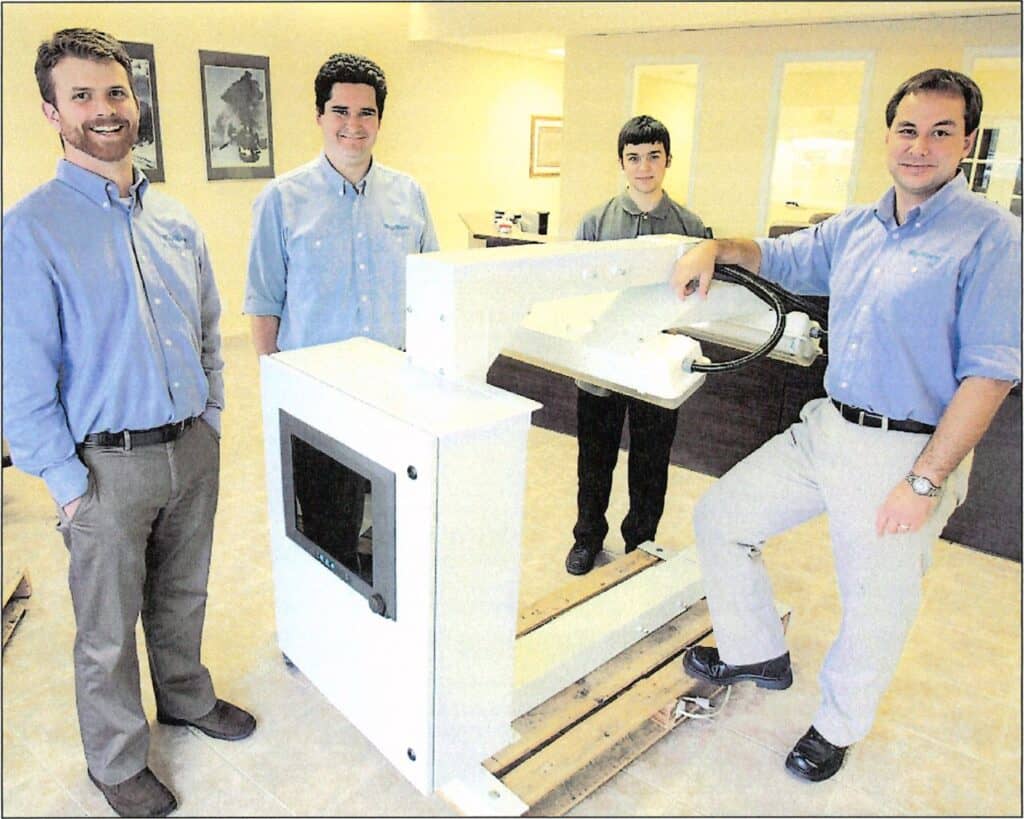
In this 2007 photo, WipWare team members gather around the first Solo system — a major step forward in automated material analysis. Originally built for conveyor belts and later adapted for vehicle loads, this early unit was the seed of what would become today’s Solo 6 а также Reflex 6 systems — smarter, faster, and tougher than ever.
Pictured here are two faces still leading WipWare forward today:
- Томас Паланжо (right), now our Chief Technical Officer and Vice President of Technology
- Kevin DeVuono (back right), now our Head Programmer
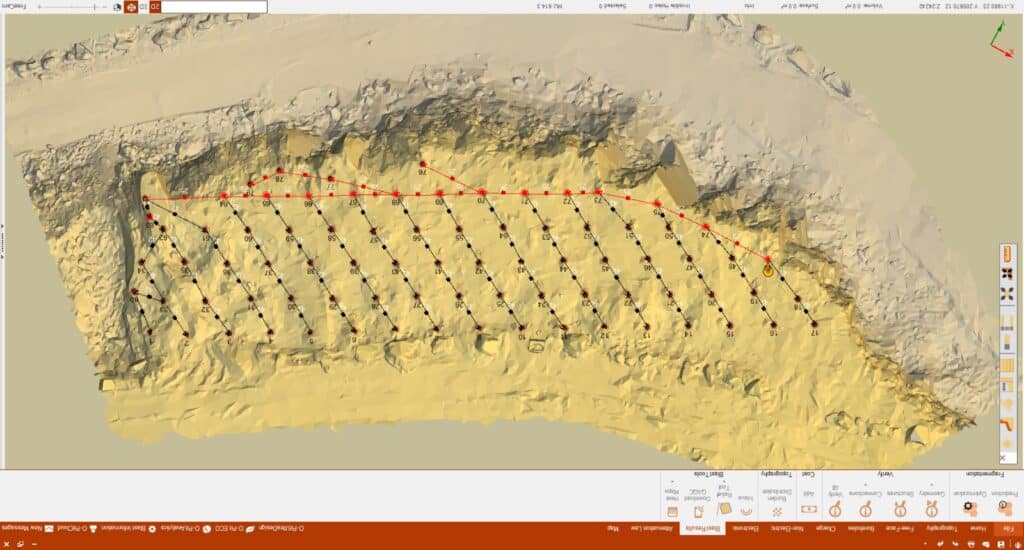
WipFrag 3 joined the arsenal in 2014 with drone and GIS capabilities, serving as HMI for our real-time analysis systems. With WipFrag now in the palm of your hand since 2016, WipWare makes it easier than ever for field personnel to assess blast fragmentation instantly, anywhere, anytime and share it across platforms for end-to-end mine-to-mill optimization.
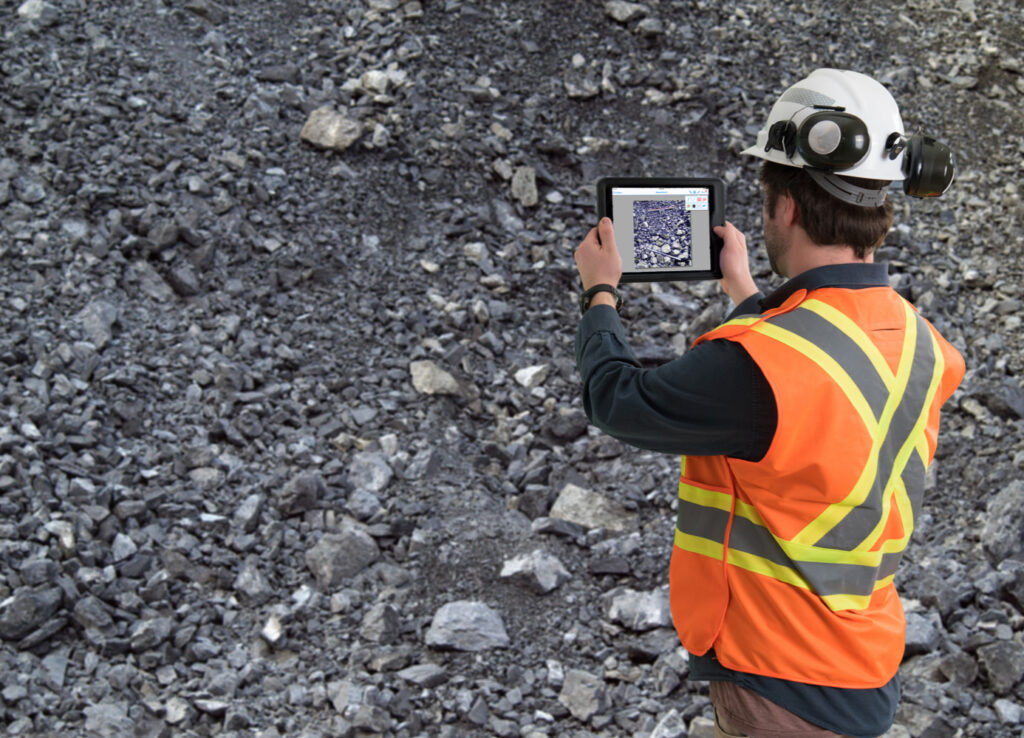
WipFrag Goes Mobile
In 2016, WipWare brought WipFrag to mobile devices — putting fragmentation analysis directly into the hands of field personnel.
For the first time, users could capture and process muckpile images using the camera on their phone or tablet, with the option to sync and share results across devices for further analysis.
This leap in accessibility made data collection faster, easier, and more flexible — using tools people already carried with them.
Designed for the real world — and it redefined the standard.
Pit to Plant Fragmentation Analysis
In 2018 Tom Palangio, President of WipWare enjoyed an interview with Партнеры Crownsmen at the CIM in Vancouver. During this interview, Tom discussed how innovation, being a disruptor in the early years and providing excellent leadership has shaped WipWare into the company it is today.
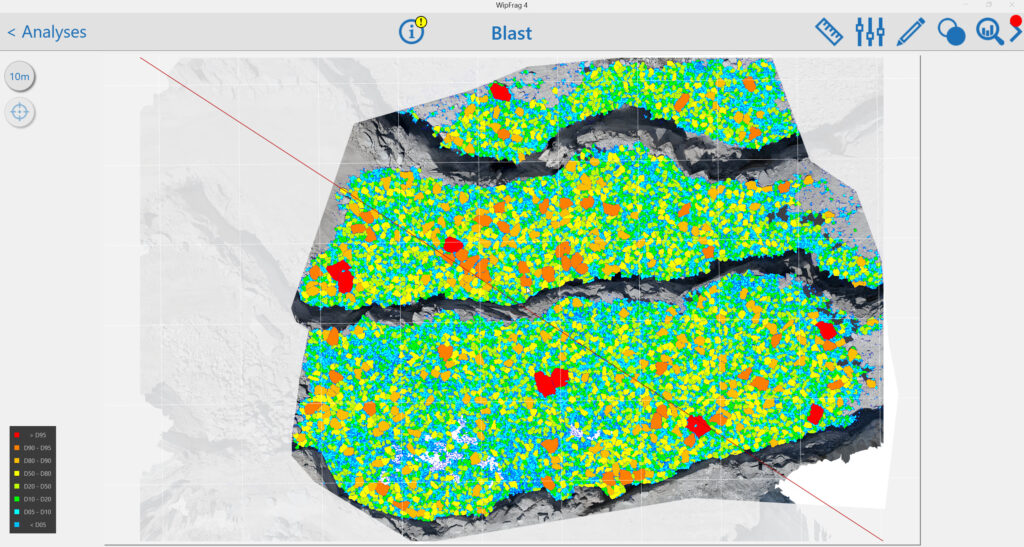
WipFrag 4 Released in 2020
In 2020, WipFrag became easier than ever for field personnel to assess blast fragmentation instantly, anywhere, anytime and share it across platforms for end-to-end mine-to-mill optimization.
Fast forward to today, under the technical direction of Томас Паланжо (CTO), the company continues to redefine industry standards. His creativity, technical drive, and future-forward thinking have powered the evolution of Solo, Reflex, and WipFrag, now enhanced with Deep Learning Edge Detection for unparalleled accuracy across all environments.
From a garage in Bonfield, to a global leader in real-time fragmentation analysis – 30 years of innovation and engineering smarter solutions for the world’s toughest industries.
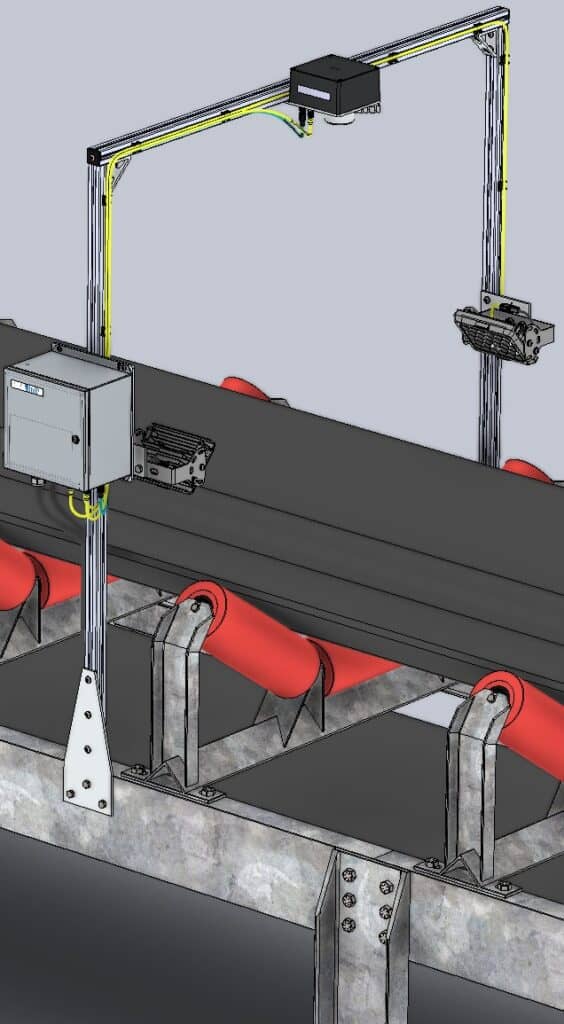
Since 1995, we’ve been shaping the future of mining technology with groundbreaking tools like WipFrag, Solo, and Reflex. Along the way, we’ve helped change how the industry collects and understands data. Today, we’re using edge-powered, AI-driven systems on conveyors and vehicles, even underground.
WipWare continues to provide the industry with powerful tools to help companies monitor, measure and manage their materials the smart way. Our state-of-the-art arsenal of analyzers measure particle size, shape, volume and colour data in real-time on conveyor belts and vehicles. Our comprehensive software is useful anywhere to instantly determine particle size and shape distribution without using a scale object.
Always Evolving, Always Innovating
But we’re not done — today our tools continue to evolve.
We’re enhancing the way our systems capture material composition and volume — bringing deeper insights to operations of every size. Plus, we’re refining how data becomes decision-making power. And now we’re working to bring that same clarity everywhere from underground to outer space.
Thank you to our technical team, whose work ensures every system and line of code is field-ready and rock solid.
Thank you to the innovators whose commitment, structure, and continuity make every innovation sustainable and scalable!
And most importantly, to our clients, resellers, and partners around the world — thank you for 30 incredible years. Here’s to what’s next. YOU are the reason our WipWare Team continues to push boundaries. Your trust, feedback, and collaboration fuel the team purpose. Whether you’re analyzing underground ore, surface muckpiles, aerial drone images, conveyor material, or vehicle loads, your success is our mission.
Here’s to 30 years of innovation, reliability, and excellence… And to the next decades of digital transformation in mining and material handling.
Выставка горнодобывающей промышленности Северного Онтарио North Bay & District Chamber of Commerce CIM/ICM Northern Gateway Branch МайнКоннект