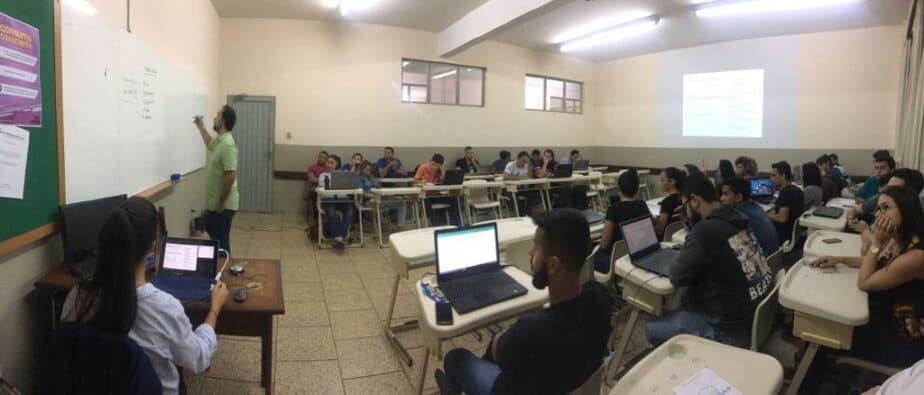
Author: Kim Coyle

Uncategorized

Photoanalysis System Calibration

By: Paul Chivers

Photoanalysis system data can be used for process control or to track relative changes without calibration. However, if your goal is to replace manual sieving then calibration is required. The calibration procedure outlined below is taken from the Calibration Document which is available to photoanalysis system users after logging into the Customer Download Area of the Downloads section of the WipWare website.

Calibration is the final step for system installation and cannot occur until all hardware and software adjustments have been characterized. These include mechanical setup; optical adjustments; scale settings; trigger settings; image quality settings and edge detection parameters. If any of these variables change, the system will require recalibration.

STEP 1: Stop Belt (perform a crash stop)

Once a system has been characterized and the process is running normally calibration can begin. Note that calibration is only effective if the material is unaffected by external variables not related to normal production (i.e., slower belts, partial process shutdown, etc…).

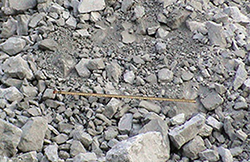
STEP 2: Image Material

In Delta, snap an image of the material. Save the image as ‘Calibration 1.bmp’ and close it. Place a scale reference (ruler, card, paper … of known dimensions) on top of the material in the viewable area. In Delta, snap another image and save it as ‘Scale 1.bmp’ before closing it.

STEP 3: Take Material for Sieving

In Delta, open the live image view. Find and mark the upper and lower limit of the viewable material on the belt. Remove the entire sample for sieving. Do not use coning, quartering, or riffling. The whole sample must be sieved.

STEP 4: Restart Belt & Sieve

All information has been gathered and your process can be restarted. Sieve the material before proceeding to next step.

STEP 5: Set Scale Factor

In Delta, open ‘Scale 1.bmp’ and set the scale using the scale reference of known length. Because the image was opened from a file, be sure the ‘Source’ is set to ‘Image File’. Close ‘Scale 1.bmp’.

STEP 6: Set EDPs

Open ‘Calibration 1.bmp’. Open the Options menu to get to the ‘Edge Detection Parameters’ tab and take note of which EDP preset is selected for the camera you are calibrating (i.e., Camera 1). Change the ‘Source’ to ‘Image File’ and select the same EDP preset from the previous step.

STEP 7: Set Size Classes

Select the ‘Output’ tab and take note of which Size Class preset is selected for the camera you are calibrating. Change the ‘Source’ to ‘Image File’ and select the same Size Class preset from the previous step. Make sure there is no calibration preset selected. Hit Apply and OK to save your changes.

STEP 8: Get Delta Values

Hit the ‘Generate Net’ button. Hit the ‘Sieve’ button. Take note of the following values: n, Xc, b, Xmax, X50. Save the chart as ‘Delta 1.bmp’. 

STEP 9: Enter Data into Calibration Sheet (See image to the right)

Only enter data in the blue squares:
1. Under ‘SIZE’, enter your size classes (largest on top).
2. Under ‘WEIGHT’, enter the weight on each sieve/pan.
3. The next column, ‘WEIGHT % RETAINED’, will be completed automatically and if done correctly the total at the bottom should be 100%.
4. Enter the ‘Xmax’, ‘X50’, ‘b’, ‘n’ and ‘Xc’ values you recorded previously from Delta into the appropriate blue box.

STEP 10: Calculate Adjust Factors (See image to the right)

With macros enabled, hit both the ‘CALIBRATE Swebrec Function’ and ‘CALIBRATE Rosin Rammler’ buttons. The Swebrec calculation is very quick. The Rosin Rammler function may take much longer. Once both functions have been completed, take note of the ‘Recommended Distribution Method’. If this reads ‘SF’, use the Swebrec adjust factors. If this reads ‘RR’, then use the Rosin Rammler adjust factors.

STEP 11: Enter Adjust Factors into Delta

In Delta, go into the Options menu and select the ‘Output’ tab. In the calibration dropdown select a ‘Calibration Preset’. You can rename this preset if you wish. Select either ‘R-R’ or ‘Swebrec’ based on what the calibration sheet recommended. Enter the adjust factors you recorded from the calibration sheet. Hit Apply/OK and put the system back online.

The System is Now Calibrated!

All steps are complete and the camera that was calibrated will now be outputting calibrated data.

Uncategorized

What Should I Use as a Proper Scale?

By: Paul Chivers

Question: What should I use as a proper scale?

Answer: It is essential to include some type of scaling device in photographs for fragmentation analysis. It’s recommended to use any solid scaling device with a contrasting color to the material which can be laid down flat on the material in question. White is usually a good choice. 

Range rods, yard/meter sticks and customized frames can all be used. We discourage the use of balls as they can expand and contract with changes in temperature and altitude. Be sure to position the scaling device horizontally in your image.

When there is a significant slope to the material you should use two scaling devices placed horizontally, one in the foreground and the other higher up the slope. WipFrag can utilize the two scales to apply perspective correction compensating for the slope of the material.

WipWare also offers the WLS-30 Light Scale, which projects a pair of green laser dots a fixed distance apart onto the material. This scaling method avoids the need to climb over the material to position and retrieve scaling devices. If tilt correction is required when using a Light Scale, the lasers should be re-calibrated to aim high in the field of view and combined with a physical scale placed in the foreground.

Uncategorized

Pit to Plant a Hit!

Participants jetted in recently from seven countries across four continents to join Canadian attendees for WipWare’s most successful training seminar ever.

The sold-out 5th Annual WipWare Training Seminar at the Canadian Ecology Centre in Samuel de Champlain Provincial Park, near North Bay, Ontario, from September 16-19, drew positive reviews from attendees from Australia, South Africa, Netherlands, UK, Brazil, Chile and the US.

This year’s Pit-to-Plant theme featured prominent speakers highlighting the importance of fragmentation data on both the blasting and processing end of operations in addition to WipWare technical staff outlining software features and automated system maintenance. Guest speakers covered a range of topics starting with an in-depth look at various blasting parameters and some exceptions to the Kuz-Ram model by the renowned Dr. Calvin J. Konya, President of Precision Blasting Services and Director of the Academy for Blasting and Explosives Technology.

Dr. Adrian Dance, principal metallurgy consultant at SRK Consulting (Canada) Inc. and a leading authority on Mine-to-Mill optimization outlined the justification for increasing drill and blast costs to achieve better fragmentation in terms of cost savings downstream in the milling operations.

Francois Robichaud, metallurgical superintendent at Agnico-Eagle described his experiences using image-based bulk material particle-size-analyzers to evaluate crusher performance and monitor SAG mill feed leading to optimized particle sizes entering their SAG mill resulting in higher throughput and reduced energy costs.

Seminar participants also received hands-on training with WipWare’s WipFrag and Delta software packages, and instruction on installation, use and maintenance of the company’s Momentum, Reflex and Solo automated systems.

Uncategorized

Enveloped By Standards

By: Mark Wagner

Every operation has a specification they need their material size to be within: Whether it’s ASTM specifications for aggregate operations, key performance indicators for crushers and SAGs, or blast metrics for explosives selection, these standards are crucial in streamlining an operation’s process.

For example: an operation in northern Quebec, Canada (if you are looking at a map of Quebec, chances are you are still not looking north enough… keep going… there you go) needed to ensure material size did not exceed 6″ in size coming out of the primary crusher, for a variety of reasons:

Energy required downstream to break down these large particles was significant

Maintenance issues in terms of damage caused by these oversize particles

Getting maintenance personnel on-site to deal with the aforementioned points was extremely costly

With the assistance of Xstrata Process Support (XPS) and a hydraulic toggle supplier, WipWare was able to not only identify when material was larger than 6″, but send signals to through a PLC that would automatically adjust the crusher mantle in order to bring the material size back in line. Just by reducing maintenance shutdowns to manually adjust the crusher setting, this operation was able to recoup the cost of the system within a year.

Even if your operation opts to manually adjust its process using WipWare’s systems as a guide, the benefits are widespread and significant. We’ve seen the timeline between liner replacements expanded drastically, and SAG feed optimized on-the-fly by utilizing online data as a standard.

…And for the folks who have dealt with paving specifications, all it takes is for a half mile of out-of-spec pavement to be pulled up to identify the importance of keeping material in between the goal posts.

Speaking more on the ground level of photoanalysis technology, envelopes can be created inside of WipFrag and Delta, so operators can identify out-of-spec material at a glance. Perhaps it’s a matter of notifying mining personnel, or shutting down a belt until liner maintenance is completed; regardless, having a tool that can help significantly in adhering to your operation’s standards can mean cost-savings, reduced downtime, and a more proactive approach to mining and milling.

Happy crushing!

Uncategorized

Getting the Picture(s): Continuous Monitoring Through Photoanalysis

By: Mark Wagner

WipWare has been in the image analysis business for about 20 years commercially, so we’ve seen a wide range of mining and aggregate sites, all with their unique challenges. One thing that stays consistent with every operation is the need to reduce particle sizes to ideal sizes for either the extraction of minerals, or for more practical uses (road building, etc.)

Blasting, crushing and grinding material down to an optimal size is difficult to do, and when you tie in trying to be efficient at the same time, production rates can fluctuate quite easily. It’s very hard to track how well the ‘rock breaking’ is going.

Queue sieving!

Manual sieving has been around for thousands of years. Nowadays, the accuracy of these sieve analysis methods is quite impressive: stop your belt, take a cut, bring material to the lab, put it in the sieve shaker, and voila! In a few hours you have your result. What could be better?

Well, let’s back it up a little and investigate: manual sieve samples are very accurate for the sample itself; however, if you use manual sampling to track, say, relative changes, you are putting a lot of faith in that one belt cut of material representing hundreds/thousands of tons of material.

You may begin to notice why WipWare systems are really taking a hold in the mining and aggregate industries: No one will ever argue that a manual sample that is sieved is not accurate; but here is a scenario I want you to consider:

You take a sample of a 1 meter belt cut every shift for analysis. When the crusher supplier asks for the material size going into the secondary crusher, you hand him/her the beautiful distribution curves with the data points in the Excel file. Based on the data, he/she decides “based on your material size, you need this kind of crusher/liner/product”.

Do those manual samples accurately represent the hundreds or thousands of tons passing through your process? What if the sample you took happened to be finer than what was typical? Chances are, as granulometry guru Jack Eloranta, of Eloranta & Associates calculates, misrepresentation could be possible. Take a look:

Assume:

400 TPH

6 m/s

1 meter belt sample per shift

Belt travels 1 meter in 0.17 seconds

0.17 sec x 1 hr/3600 sec x 400 t/hr = .019 tons

.019 t/(8 x 400) t = .0000059

Really, when you take a look at how representative a manual sample is, you are looking at 0.00059% of your conveyor material in this example.

With a percentage like that, I’ll take continuous, non-disruptive particle sizing any day.

So let’s summarize so far: Manual sieving is accurate for the material actually being sieved, but may not adequately represent what is running through your process on a continuous basis.

What’s WipWare’s role in all of this? Well, it’s really a complementary thing. WipWare is the ying to sieving’s yang, the Sunny to sieving’s Cher…I’ll stop now.

WipWare’s systems offer continuous monitoring of material. That’s right. 24/7/365 analysis of the most important part of the mining process; the whole reason billions upon billions of dollars are spent each year; the reason why mine and mill employees have a love/hate relationship – the size of material! Manual sieve results can be tied into the WipWare data using Rosin-Rammler or Swebrec functions, covering both the quantity of data needed for accurate analysis, with the quality manual sample information.

So, next time you are taking buckets of material from a conveyor belt for manual analysis, consider the benefits of having a continuous, non-disruptive system in place that will give you a better snap shot of what’s passing through your operation.

en_USEN