WipWare has been in the image analysis business for over 30 years commercially. We’ve seen a wide range of mining and aggregate sites, all with their unique challenges. One thing that stays consistent with every operation is the need to reduce particle sizes to ideal sizes for either the extraction of minerals, or for more practical uses (road building, etc.)
Blasting, crushing and grinding material down to an optimal size is difficult to do. When you tie in trying to be efficient at the same time, production rates can fluctuate quite easily. It’s very hard to track how well the ‘rock breaking’ is going.
Setacciatura della coda!
La setacciatura manuale esiste da migliaia di anni. Al giorno d'oggi, l'accuratezza di questi metodi di analisi del setaccio è piuttosto impressionante: ferma la cintura, fai un taglio, porta il materiale in laboratorio, mettilo nel setaccio e voilà! In poche ore hai il tuo risultato. Cosa potrebbe esserci di meglio?
Well, let’s back it up a little and investigate. Manual sieve samples are very accurate for the sample itself. However, if you use manual sampling to track, say, relative changes, you are putting a lot of faith in that one belt cut of material representing hundreds/thousands of tons of material.
Manual Sieving vs Continuous Monitoring
You may notice why WipWare systems are really taking a hold in the mining and aggregate industries: No one will ever argue that a manually sieving a sample is not accurate; but here is a scenario I want you to consider:
You take a sample of a 1-meter belt cut every shift for analysis. When the crusher supplier asks for the material size going into the secondary crusher, you hand him/her the beautiful distribution curves with the data points in the Excel file. Based on the data, he/she decides “based on your material size, you need this kind of crusher/liner/product”.
Do those manual samples accurately represent the hundreds or thousands of tons passing through your process? What if the sample you took happened to be finer than what was typical? Chances are, as granulometry guru Jack Eloranta, of Eloranta & Associates calculates, misrepresentation could be possible.
Take a look:
Assumere:
400 TPH
6 m/s
Campione di nastro da 1 metro per turno
La cintura percorre 1 metro in 0,17 secondi
0,17 sec x 1 ora/3600 sec x 400 t/ora = 0,019 tonnellate
.019 t/(8 x 400) t = .0000059
Really, when you look at how representative a manual sample is, you are looking at 0.00059% of your conveyor material in this example.
With a percentage like that, I’ll take continuous, non-disruptive particle sizing any day.
So let’s summarize so far: Manual sieving accurately measures the sampled material but may not represent the material continuously running through your process.
What’s WipWare’s role in all of this?
Well, it’s really a complementary thing. WipWare is the ying to sieving’s yang, the Sunny to sieving’s Cher…I’ll stop now.
WipWare’s systems offer continuous monitoring of material. That’s right. 24/7/365 analysis of the most important part of the mining process; the whole reason billions upon billions of dollars are spent each year; the reason why mine and mill employees have a love/hate relationship – the size of material! Manual sieve results can be tied into the WipWare data using Rosin-Rammler or Swebrec functions, covering both the quantity of data needed for accurate analysis, with the quality manual sample information.
WipWare’s systems offer continuous monitoring of material. That’s right. 24/7/365 analysis of the most important part of the mining process; the whole reason billions upon billions of dollars are spent each year; the reason why mine and mill employees have a love/hate relationship – the size of material! Manual sieve results can be tied into the WipWare data using Rosin-Rammler or Swebrec functions, covering both the quantity of data needed for accurate analysis, with the quality manual sample information.
Riflesso
Evaluating Rock Comminution Pre-Blast to Post-Blast and Through Mineral Processing
The Need for Energy Efficiency Assessment in Blasting
In today’s mining and quarrying operations, energy efficiency remains one of the most pressing challenges. Blasting, being the first step in the comminution process, consumes a significant portion of total energy in mineral production. Yet, the true measure of blasting efficiency is not merely how rock is broken, but how well the resulting fragmentation supports downstream processes such as crushing and grinding.
A tool is therefore needed to assess and quantify the energy utilization in blasting, specifically through fragmentation analysis. By analyzing fragmented rock sizes in terms of percentage passing, engineers can evaluate how effectively a particular blast design converted explosive energy into rock breakage. Since controllable parameters such as burden, spacing, charge distribution, and initiation timing govern how explosive energy is distributed within the rock mass, understanding fragmentation helps determine how these parameters interact with uncontrollable factors like rock structure and discontinuities.
WipWare: The Global Ruler for Rock Size Assessment
WipWare Inc. is well known as the world leader in rock size measurement and fragmentation analysis. Known as the ruler for rock size assessment, WipWare provides innovative tools that quantify particle size distributions (PSD) from pre-blast through post-blast and into mineral processing stages, creating a continuous feedback loop for process optimization.
Pre-Blast Assessment with WipJoint
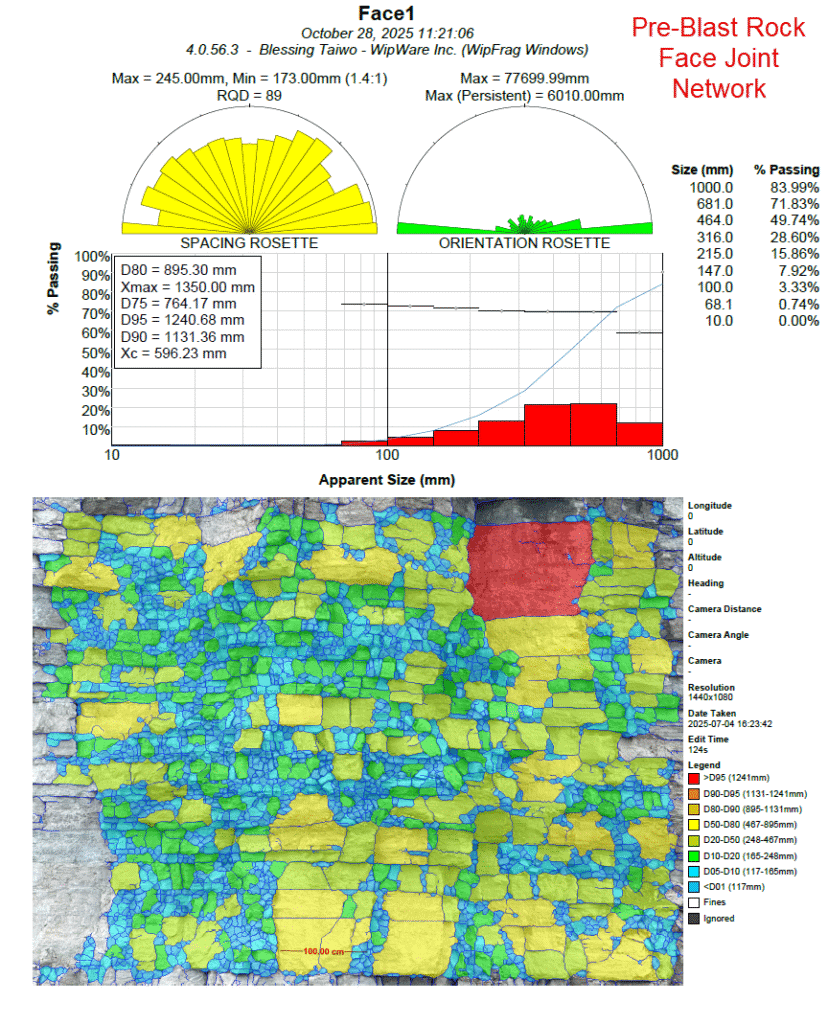
Understanding the geological conditions before blasting is crucial for predicting fragmentation outcomes. To bridge the gap between rock mass discontinuity and fragmentation potential, WipWare re-introduced WipJoint, a technology developed in 1990 by Dr. Norbert Maerz, Dr. John Franklin, and Dr. Tom Palangio.
WipJoint enables users to assess rock joint apparent spacing, apparent orientation, RQD and apparent in-situ block size from digital images of rock faces. This pre-blast information is invaluable for correlating structural conditions with post-blast fragmentation results. By analyzing joint characteristics, mining engineers can refine their blast design to ensure optimal energy distribution within the rock mass, thereby improving fragmentation and reducing energy waste in subsequent comminution stages.
Post-Blast Fragmentation Analysis with WipFrag
Once blasting is completed, WipFrag provides the most reliable and efficient means for evaluating fragmentation results. Using advanced image analysis, WipFrag calculates the particle size distribution (PSD) of fragmented rock piles and compares the results to target sizes such as the primary crusher’s gape.
This capability allows for quantitative comparison between different blast designs, helping to identify which parameters yield the best fragmentation for energy efficiency and crusher compatibility. With tools like specification envelopes and boulder detection, WipFrag makes it possible to assess whether the blast produced the desired material size and shape for downstream processes.
Material Assessment During Haulage with Reflex 6
Fragmentation control doesn’t stop at the muck pile. During haulage, WipWare’s Riflesso extends analysis to every truckload of material. Equipped with high-resolution cameras and an onboard computer, Reflex captures real-time images of material in transit, either while loaded on the truck or when being dumped at the crusher hopper or stockpile.
This technology enables continuous monitoring of material quality from each blast bench, providing operators with valuable data on fragmentation size, shape, uniformity and ore type variation. The Reflex system thus acts as vehicle load assessment platform, ensuring that no load goes unanalyzed.
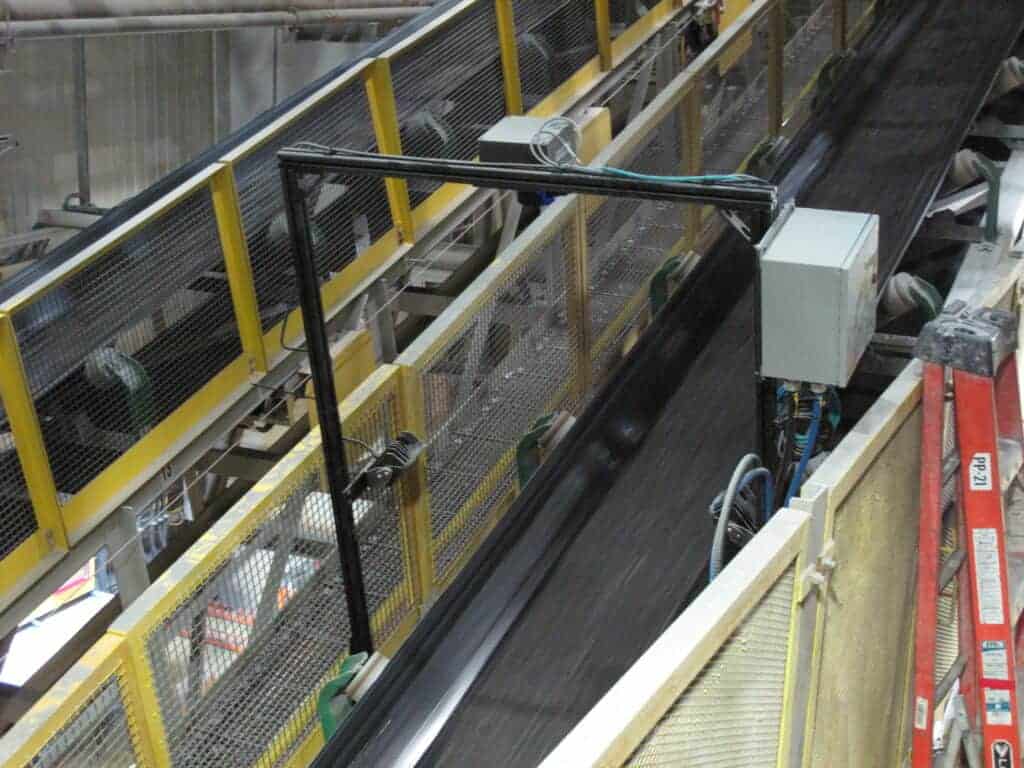
Conveyor Belt Monitoring and Process Optimization with Solo 6
At the mineral processing stage, WipWare Assolo revolutionizes comminution monitoring. Installed over conveyor belts, Solo continuously analyzes the size distribution of material feeding the crusher or exiting as product. This intelligent system provides live feedback to operators, empowering them to make real-time decisions for process optimization.
Solo integrates seamlessly with existing process control systems such as Modbus TCP and OPC UA, allowing direct communication with plant control networks. This enables automatic crusher gap adjustment, SAG mill feed control, and load balancing, ensuring that the plant operates within optimal limits.
By maintaining consistent feed size and adjusting operational parameters accordingly, Solo helps minimize bearing pressure, reduce liner wear, improve throughput, and enhance overall energy efficiency throughout the comminution circuit.
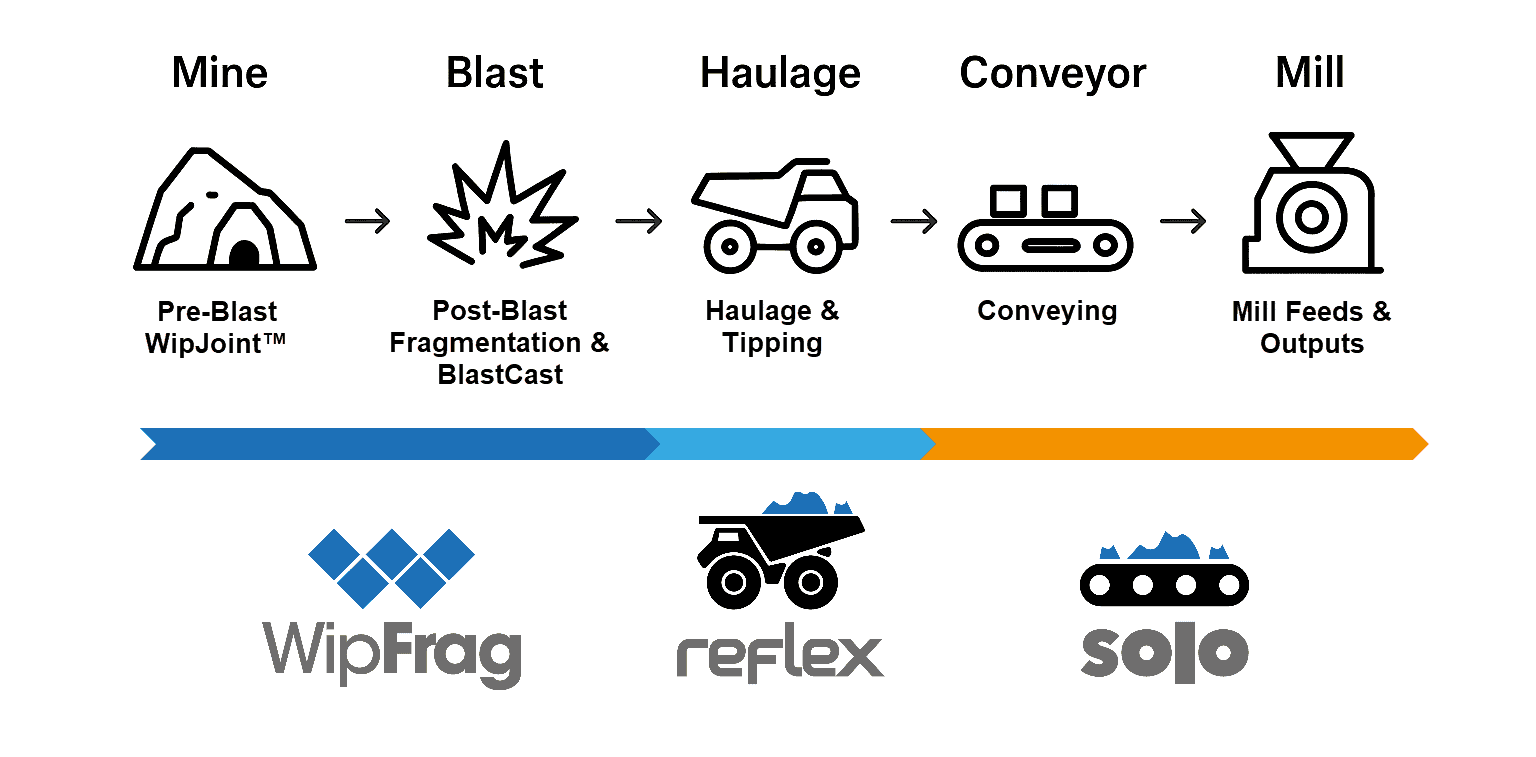
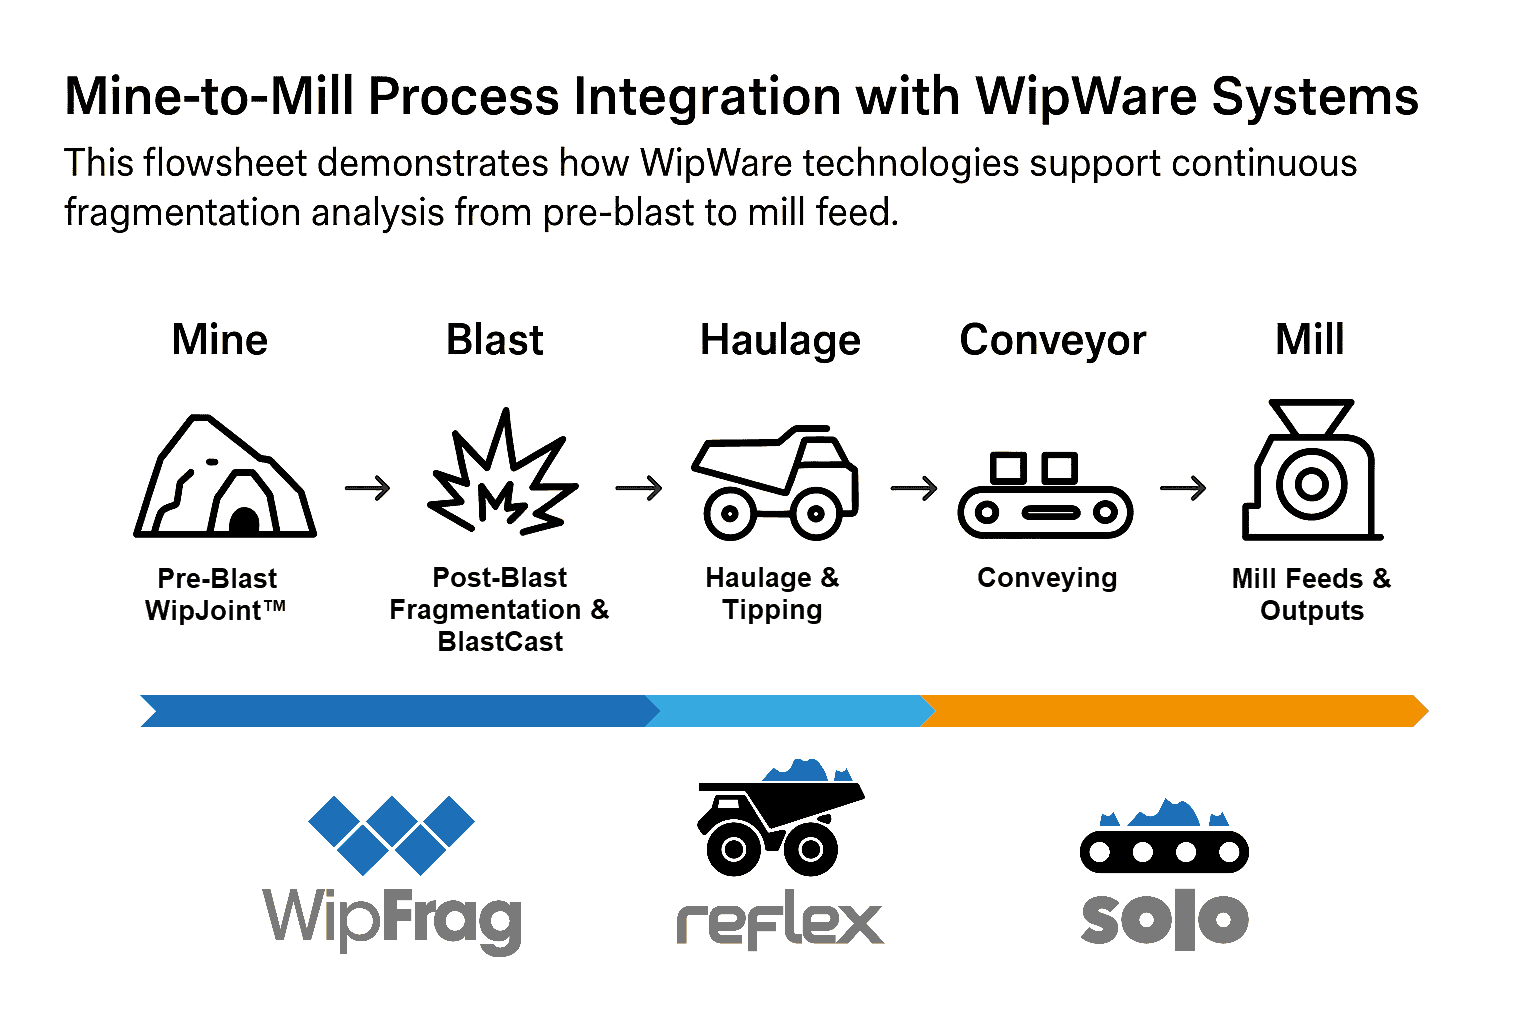
WipWare technology provides a fully integrated suite of solutions that cover every stage of the comminution chain, from pre-blast geological assessment (WipJoint), through post-blast fragmentation evaluation (WipFrag), haulage assessment (Reflex), and processing control (Solo). By quantifying and connecting each step, WipWare enables mines to measure, monitor, and optimize energy use across the entire operation. The result is smarter blasting, improved crusher efficiency, and a more sustainable approach to mineral processing, achieving the ultimate goal of energy-efficient comminution.
Mine-to-Crusher Application of WipWare Solutions: Case Study at dstgroup Quarry
This study presents the third phase of a three-part research series focused on optimizing the interface between blasting and primary crushing operations at dstgroup aggregate quarry in Portugal, using WipWare solutions. The central goal is to improve fragmentation outcomes to better align particle size distribution (PSD) with crusher requirements, thereby reducing energy consumption and enhancing operational efficiency.
Building on the baseline methodology developed in Part 1, which incorporated 3D bench modeling and borehole surveys to assess blast compatibility with crusher specifications, the study identified discrepancies between predicted and actual fragmentation results. Part 2 applied targeted adjustments, such as reducing subdrill depth and altering stemming material, achieving measurable improvements in D80, maximum fragment size, and overall blast efficiency. However, boulder formation persisted in certain blast rows, prompting further optimization.
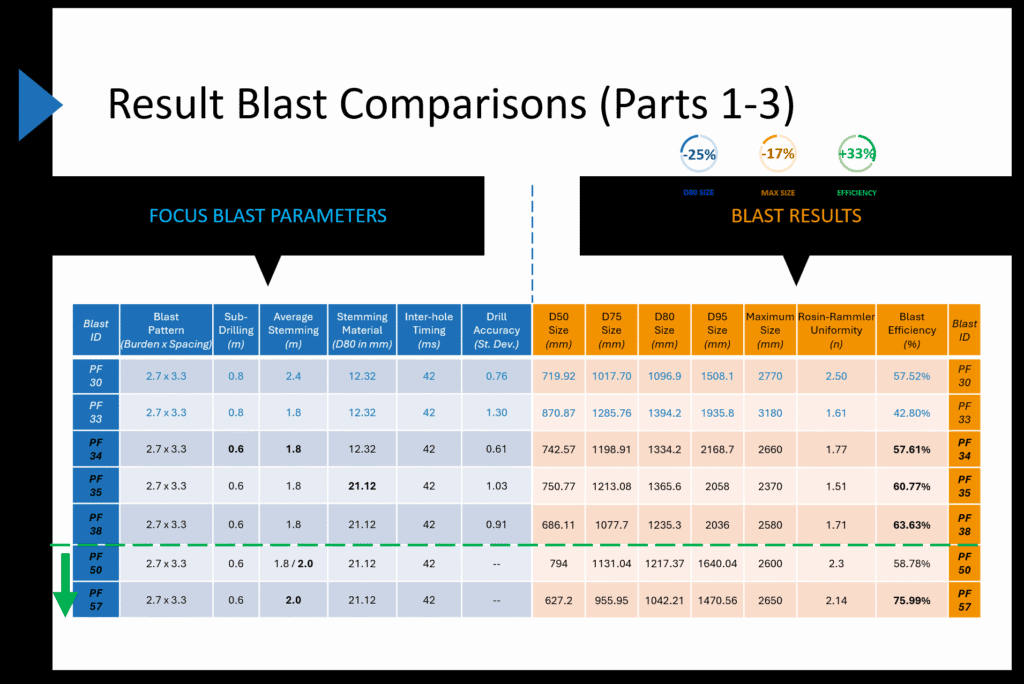
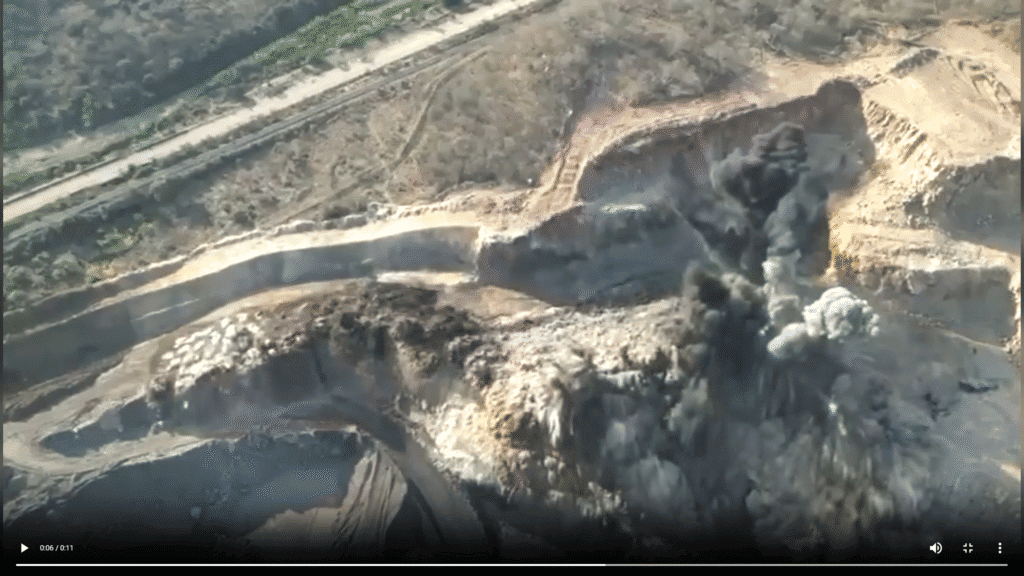
In this phase, the team implemented remaining recommendations, including refined drill and blast patterns, increased stemming size (from D80 12 mm to 21 mm) and length (from 1.8 m to 2 m), improved drilling accuracy, and adjusted inter-hole timing. High-resolution drone imagery and point-by-point blast surveys were integrated into O-PitSurface simulations to evaluate blast performance. WipFrag software was utilized for detailed particle size analysis, enabling comparison of fragmentation outcomes before and after design modifications.
Results demonstrated significant gains: D50 decreased by 19%, D80 and D95 by 20% and 23%, respectively, and maximum particle size reduced by 3%, indicating better control over oversized material. Fragmentation efficiency improved by over 21%, and the uniformity index increased by 16%, reflecting more consistent and predictable PSD. Adjustments to stemming material and length enhanced energy confinement, minimizing premature blowout and promoting even energy distribution throughout the blast column.
Run-of-mine monitoring with the Reflex system above the primary crusher provided real-time PSD analysis, confirming continuous improvement in fragmentation and crusher feed consistency. Over a six-month period, key size distribution metrics consistently trended downward, validating the effectiveness of iterative blast parameter adjustments and demonstrating the value of data-driven, integrated mine-to-crusher strategies.
In conclusion, the study illustrates how WipWare solutions, including WipFrag, Reflex, and O-PitSurface, enable quarry operations to optimize fragmentation, reduce oversize and fines, improve crusher compatibility, and enhance overall operational efficiency. The mine-to-crusher framework serves as a replicable model for energy-efficient, predictable, and high-performance blast-to-crusher integration.
Quali parametri di rilevamento dei bordi (EDP) dovrei usare?
Quando si utilizza WipFrag per analizzare le pile di letame, è possibile utilizzare le seguenti linee guida:
Multe = Cursori a destra
Medio = Cursori nel mezzo
Large = Cursori a sinistra
Generally, you want to have accurate nets on the small- to medium-sized particles. Once you find a suitable net for this size of material you can manually edit the larger material. Using this method will help provide more accurate results.
It’s also recommended that you try to keep a similar EDP for images of the same muck pile, or when trying to compare different muck piles.
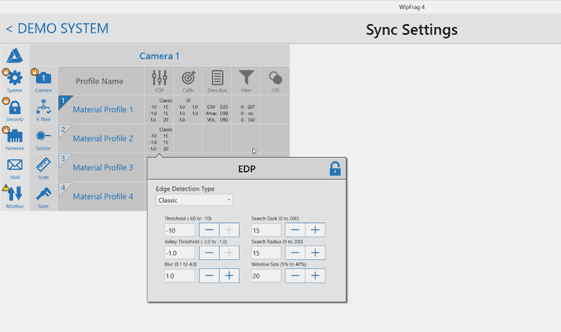
If finer adjustments are required, you can activate the ‘Show Advanced Controls’ checkbox to access numeric inputs featuring a wider range of finer adjustments than the basic sliders provide.
WipWare Automated Photoanalysis Systems and EDP
In Delta, una versione avanzata del software WipFrag che funziona sui sistemi di fotoanalisi automatizzata WipWare, utilizziamo un processo chiamato Best Fit EDP. Per i sistemi online, questo processo viene solitamente eseguito in loco al momento dell'installazione. Viene implementato prendendo un'immagine di materiale tipico una volta che tutte le impostazioni hardware e software sono state completate. Tracciamo manualmente il maggior numero possibile di particelle e quindi eseguiamo la funzione Best Fit EDP. Il software cercherà quindi di abbinare la traccia manuale delle particelle utilizzando le impostazioni EDP disponibili. Best Fit EDP emette una serie di valori numerici che verranno inseriti nei controlli avanzati EDP. Questo metodo è molto accurato e fornisce ai nostri sistemi online parametri di rilevamento dei bordi adatti. È raro che un sistema EDP online debba essere modificato, ma in tal caso è possibile farlo in remoto dalla nostra sede.
Best Fit EDP was recently added to WipFrag software. Because of the time involved in editing an image to produce a good Best Fit EDP, this feature is most practical to reduce the amount of manual editing required if you are going to be analyzing many images (20, 30 or more) of the same material under the same conditions. For most users, where smaller batches tend to be analyzed at once, using the sliders to adjust the EDP is faster.
Within WipFrag, there is also a feature called Auto EDP which attempts to determine the edge detection parameters automatically. This feature works well if the particle size range is narrow.
WipWare’s fragmentation analysis technologies have been widely applied across various mining operations to solve critical challenges. These were associated with material flow, fragmentation consistency, energy use, and overall process efficiency. I came across Tom Palangio‘s works on numerous case studies highlighting the effectiveness of WipWare‘s tools. These tools optimized blasting practices and downstream processing. This review presents a summary of several influential studies and industrial applications of WipWare technology.
Photographic Fragmentation Analysis
Selbaie Mine, Joutel, Quebec, Canada
In the mid-1990s, Selbaie Mine utilized photographic fragmentation analysis using WipFragto assess explosive performance and optimize blasting patterns. The integration of WipWare technology enabled the mine to monitor and control several key performance indicators. Some of these indicators included energy consumption for crushing, loading rates, haul truck payloads, secondary blasting costs, and maintenance expenditures. Fragmentation data revealed a more comprehensive understanding of the effects of blast results on overall mining cost structures. This information allowed the mine to better manage ore processing operations. They could quantify the true cost of mineral handling based on fragment size.
Significant Pattern Optimization
INCO Coleman Mine, Sudbury, Ontario, Canada
INCO’s Coleman Mine used WipFrag during a detailed study in 1994, resulting in significant pattern improvement. The original tight blast pattern (5ft x 10ft) yielded a characteristic size (Xc) of 0.617 m, with substantial oversize material requiring re-blasting. Progressive expansion of the blast pattern to 6ft x 10ft and eventually 7ft x 10ft not only improved fragmentation (Xc = 0.318 m) but also reduced oversize entirely. WipFrag data was instrumental in determining optimal fragmentation, with INCO realizing up to 40% blast pattern expansion and 80% cost savings. Additionally, the technology allowed for reductions in fines generation, further streamlining ore handling and improving crusher feed quality.
Correlate Ore Fragmentation and Hardness with Mill Performance
Highland Valley Copper, Logan Lake, British Columbia, Canada
At Highland Valley Copper (HVC), the team used WipWare tools to correlate ore fragmentation and hardness with mill performance. WipWare’s WipFrag software, Reflex vehicle analysis system and Solo conveyor analysis system played a central role in tracking ore size distributions from the pit through to the mill feed. This enabled real-time optimization of crusher and mill settings. The mine’s dispatch system integrated fragmentation data to guide stockpile management and minimize feed segregation. WipFrag analysis revealed that feed consistency across the grinding lines could be improved by adjusting feeder ratios. This capability to quantify fragmentation effects allowed HVC to perform cost benefit analyses and optimize the balance between blast quality and mill throughput.
Detonator Timing Accuracy and Improved Fragmentation using WipFrag
Bartley and Trousselle – Ogdensburg, New York, USA
At Benchmark Materials Quarry, Bartley and Trousselle demonstrated the link between detonator timing accuracy and improved fragmentation using WipFrag. Digital programmable detonators yielded superior blast uniformity and reduced vibration levels. WipWare’s image analysis facilitated the evaluation of blast performance improvements by providing accurate fragmentation size distribution data.
The Effects of Improved Fragmentation on Mechanical Performance and Power Usage in the Crushing Circuit
Lafarge Canada Inc. – Exshaw, Alberta, Canada
Lafarge’s Exshaw operations applied WipFrag to examine the effects of improved fragmentation on mechanical performance and power usage in the crushing circuit. A redesigned blast using 102 mm holes led to more uniform fragmentation. This resulted in a 16% increase in crusher throughput and a 30% reduction in power consumption. WipWare data also informed decisions related to equipment selection (e.g., drill bits) and wall control, leading to improved safety and reduced vibration impacts on neighboring communities.
Cost-Effective and Reliable Fragmentation Assessment Tool
Barkley and Carter – Evaluation of Optical Sizing Methods
Barkley and Carter evaluated WipFrag as both a cost-effective and reliable fragmentation assessment tool. Their work highlighted that previous blast optimization efforts were constrained by the lack of efficient sizing techniques. In contrast, WipFrag enables meaningful decision-making in blast modeling, mining method selection, and economic planning. The study underscored the significance of image-based sampling frequency, particularly in varied muck pile conditions, to derive actionable insights on crusher performance and feed consistency.
Assess Fragmentation and Stemming Uniformity
Chiappetta, Treleaven, and Smith – Panama Canal Expansion
During the expansion of the Panama Canal, WipFrag was employed to assess fragmentation and stemming uniformity in complex geological and logistical conditions. The integration of WipWare into blasting operations enabled engineers to both track blast outcomes and support adaptive design decisions in real time. In a project characterized by not only marine traffic but also saturated zones and tight deadlines, the technology provided essential support in achieving controlled fragmentation and predictable material handling.
Conclusion
These reviewed case studies emphasize WipWare’s critical role in improving the efficiency and economics of mining operations. Through accurate and real time fragmentation analysis, WipWare technologies facilitate optimization across the mine to mill value chain. From reducing energy consumption and equipment wear, to improving blast designs and minimizing fines, WipWare’s technologies offer robust solutions to a range of material flow problems in both surface and underground mining environments. These outcomes underscore the value of fragmentation analysis in modern mining practice, unquestionably supporting data-driven decision making and continuous process improvement.
By Blessing Taiwo
Riflesso
Understanding the Fundamentals of Blasting and Fragmentation – Part 1
Blasting is a critical operation in mining, quarrying, and construction that involves the controlled detonation of explosives to break rock into manageable fragments. The fundamental principle behind blasting lies in understanding the interaction between explosive energy and rock mechanics, particularly the propagation of shock waves and the subsequent formation of fractures.
The Shock-Wave Theory of Blasting
The shock-wave theory provides a framework for understanding how explosive energy transforms into mechanical work, breaking the rock. As mentioned by Hino, (1956), when an explosive charge detonates, it generates an intense shock wave accompanied by a rapid release of gas and energy.
This energy produces two primary effects:
1. Crushed Zone Formation:
Near the explosive charge, the rock undergoes intense compressive stress, exceeding its compressive strength. This creates a crushed zone, a region where the rock is pulverized into fine fragments. However, because rocks generally have a high compressive strength, this crushed zone is limited to the immediate vicinity of the charge.
Figure 1 )Shadab Far et al., 2019)
2. Shock Wave Propagation:
Beyond the crushed zone, a high-pressure shock wave propagates outward as a compressive wave. This wave does not immediately cause rock breakage but transfers energy through the rock mass.
At the first free face (a boundary with no external constraint, such as the surface of a bench or tunnel wall), the compressive wave reflects as a tensile wave. In rock mechanics, this transition is crucial because rocks are significantly weaker under tensile stress than under compressive stress. As the tensile wave interacts with the rock, fractures form when the effective tension the difference between the reflected tensile wave and any residual compression exceeds the rock’s tensile strength (Himanshu et al., 2024).
Thickness of the First Slab and Fragmentation
The initial fracture caused by the tensile wave occurs at a distance from the free face known as the thickness of the first slab (Hino, 1956). This distance is critical because:
It determines the size of the initial fragment.
Other fragment dimensions are generally proportional to this thickness.
If the remaining compressive wave retains sufficient energy after the detachment of the first slab, it continues propagating outward (See Figure 2). This process repeats at newly created free faces, producing successive layers of fractures and reducing the rock into smaller fragments. The cycle continues until the energy of the compressive wave diminishes below the tensile strength of the rock.
The interaction between these phenomena: shock wave propagation, energy dissipation, and rock strength, governs the fragmentation process. Understanding these principles allows blasting engineers to optimize blast designs to achieve desired fragment sizes, minimize blast induced issues like ground vibration, flyrock, overbreak, and ensure efficient downstream operations.
Factors Affecting Shock-Wave Propagation and Fragmentation
Several factors influence the effectiveness of a blast and the resulting fragmentation:
1. Explosive Properties
The energy content, detonation velocity, and confinement of explosives significantly affect the shock wave’s intensity and duration.
2. Rock Properties
Variations in rock strength, density, and structure (e.g., joints, fractures, and bedding planes) influence the propagation of shock and tensile waves.
3. Blast Design Parameters:
Hole diameter, spacing, burden, and the placement of charges determine the distribution of energy and the resulting fragmentation.
4. Free Face Orientation:
The presence and orientation of free faces play a pivotal role in enabling tensile wave reflection and fracture initiation.
5. Energy Distribution:
Proper distribution of explosive energy ensures uniform fragmentation and minimizes the generation of oversize boulders or fines.
Importance of Fragmentation in Mining Operations
Effective fragmentation is essential for the efficiency and cost-effectiveness of mining operations. Well-fragmented rock facilitates:
Reduced loading and hauling costs.
Improved crusher throughput and efficiency.
Lower energy consumption in downstream processing.
Enhanced safety by minimizing the occurrence of hazardous oversize boulders.
Importance of Assessing Blast Performance and Output
WipFrag, a state-of-the-art image analysis software, revolutionizes the assessment of blast performance and fragmentation. By analyzing images of fragmented rock, WipFrag provides precise and actionable insights into the quality of a blast. Here’s how WipFrag enhances blasting operations:
1. Particle Size distribution (PSD) Analysis:
WipFrag generates PSD curves that quantify the size range of rock fragments, enabling operators to evaluate whether the fragmentation meets specifications.
2. Specification Envelope Assessment
The software allows users to define specification envelopes for crusher-compatible fragmentation. Deviations from these envelopes highlight areas for improvement in blast design.
3. Boulder Identification and Counting:
WipFrag’s advanced algorithms detect and count oversize boulders, providing critical data for optimizing explosive placement and burden.
4. Image Merging and Orthomosaic Integration:
The capability to merge multiple images ensures comprehensive analysis of large muck piles. Integration with drone orthomosaics enables wide-area assessment of blast results.
5. Continuous Improvement:
By comparing fragmentation results across blasts, WipFrag supports continuous improvement in blasting practices, reducing costs and improving efficiency.
6. Real-Time Analysis:
Integration with systems like Solo 6 and Reflex 6 facilitates real-time monitoring and analysis, ensuring immediate feedback for decision-making.
Figure 3
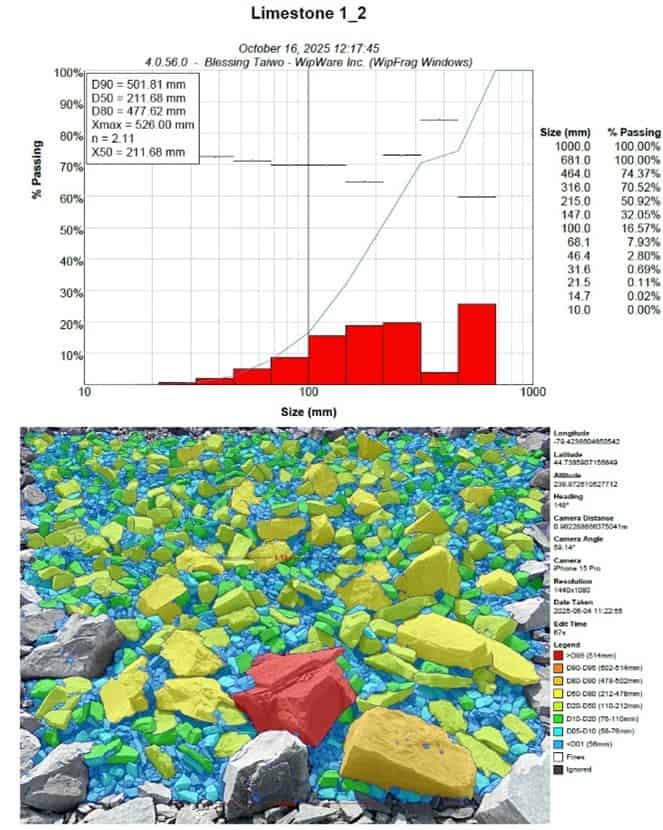
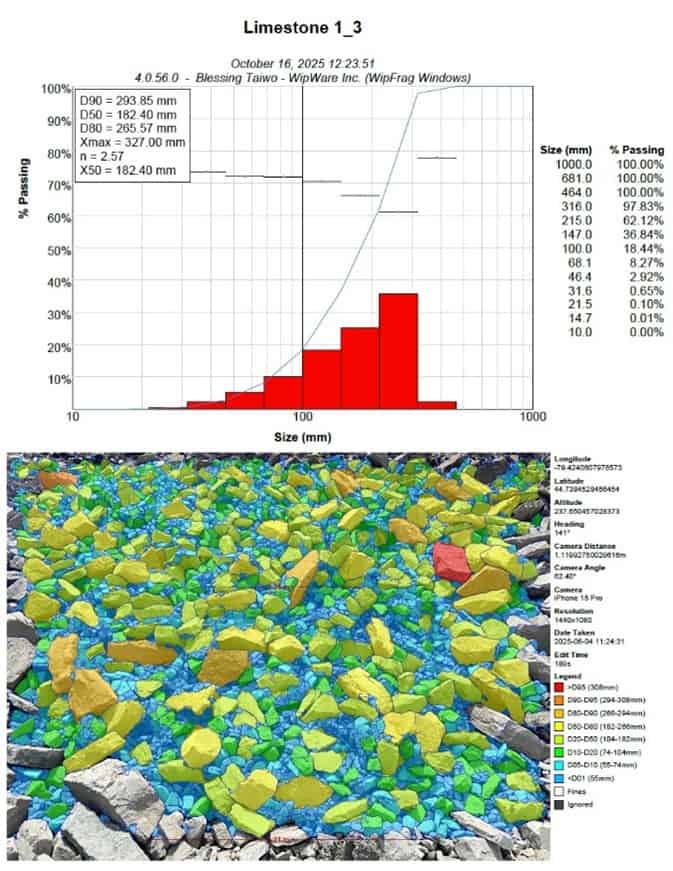
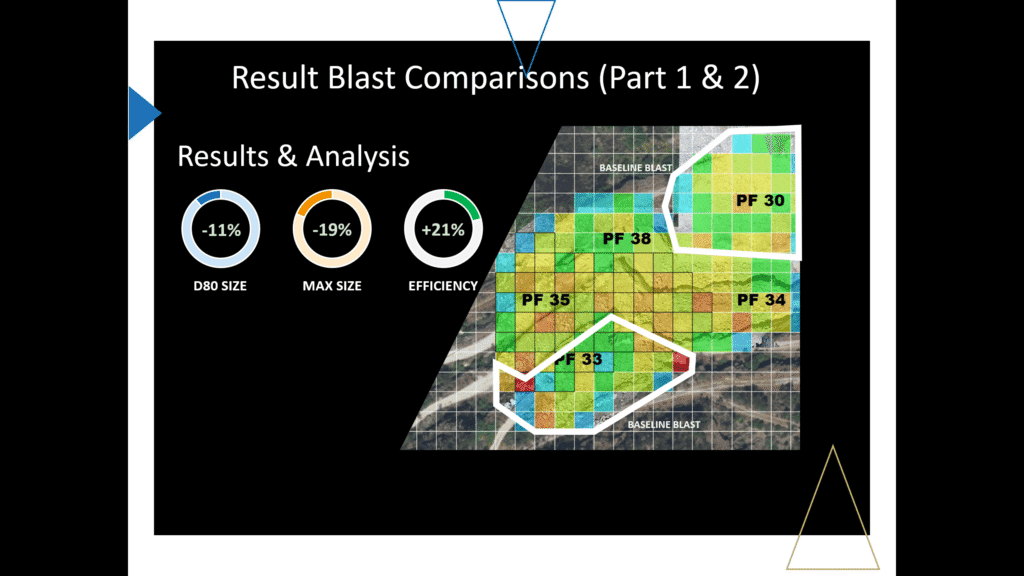
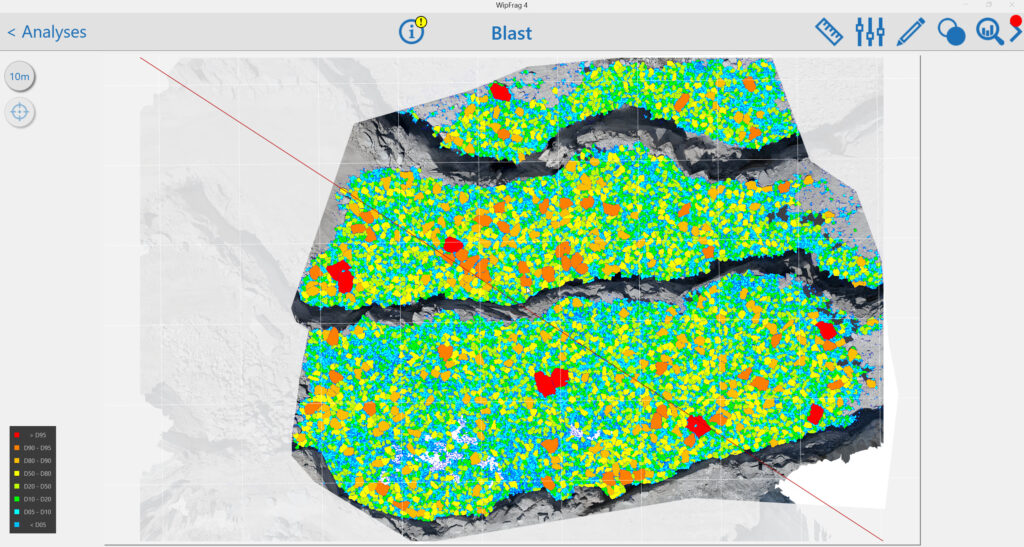
Figure 3 showcases results obtained from the WipFrag software, illustrating its capabilities in fragmentation analysis.
Figure 3a presents the GIS-integrated on-site fragmentation assessment. This feature, embedded within WipFrag, allows users to visualize blast results spatially. The red sections of the GIS map highlight areas with poor blast outcomes, whereas lighter colors like blue and green represent zones with favorable fragmentation.
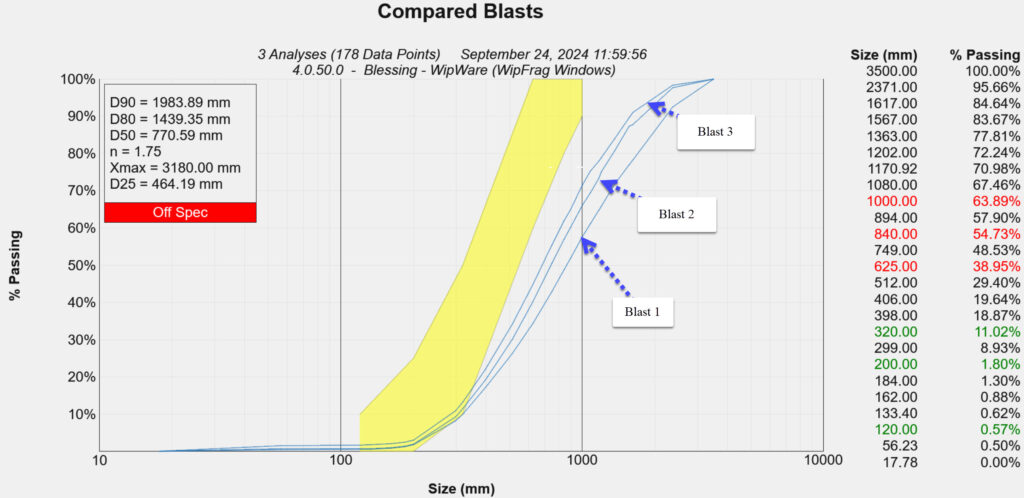
Figure 3c displays the Particle Size Distribution (PSD) curves comparing three different blasts. The yellow envelope outlines the production specification of the case study mine, serving as a benchmark. WipFrag enables each mine to define their Key Performance Indicator (KPI) sizes and utilize them for ongoing assessments. This facilitates the evaluation of blast improvements over successive rounds.
Additionally, the PSD curves feature size classifications and flag specific sizes that deviate from mine production requirements, ensuring precise monitoring and alignment with operational goals.
This comprehensive analysis provided by WipFrag aids in identifying areas of improvement, optimizing blasting strategies, and enhancing overall mining efficiency.
Conclusion
Blasting and fragmentation are complex processes driven by the interaction of explosive energy, rock mechanics, and blast design parameters. Understanding these fundamentals is essential for optimizing operations and achieving desired outcomes. WipFrag software plays a pivotal role in this optimization by providing detailed and accurate fragmentation analysis, enabling operators to assess performance, identify areas for improvement, and implement data-driven strategies for continuous enhancement. With tools like WipFrag, the mining industry can achieve safer, more efficient, and cost-effective blasting operations (download software here https://wipware.com/get-wipfrag/).
References
Hino, K. (1956). Fragmentation of rock through blasting and shock wave theory of blasting. In ARMA US Rock Mechanics/Geomechanics Symposium (pp. ARMA-56). ARMA.
Himanshu, V. K., Bhagat, N. K., Vishwakarma, A. K., & Mishra, A. K. (2024). Principles and Practices of Rock Blasting. CRC Press.
Shadab Far, M., Wang, Y., & Dallo, Y. A. (2019). Reliability analysis of the induced damage for single-hole rock blasting. Georisk: Assessment and Management of Risk for Engineered Systems and Geohazards, 13(1), 82-98.
We’ve put together some photoanalysis systems FAQs based on questions from our customers.
Does WipWare Technology give Real Time analysis results?
WipWare Image Analysis Systems produce real-time 24/7 results that allow personnel to identify, evaluate, and optimize troublesome areas of their process while maintaining production. Our systems are installed in many different applications around the world. These applications vary from analyzing wood chips to detecting oversize material or contamination in diamond mines. The applications are endless. From Mine to Mill The term Mine to Mill highlights the importance of fragmentation data on both the blasting and processing end of operations. This term applies well to WipWare line of products from the muckpile after a blast to analyzing material on the conveyor. Mine-to-mill technology takes the entire system into account, from the blasting process to the comminution circuit. This optimization provides a complete fragmentation and size reduction solution to maximize benefit. Software di analisi delle immagini WipFrag WipWare’s WipFrag 4 Image Analysis Software effectively analyzes data from a recent blast and produces results of the blast material on-site in minutes. Sistema di analisi del veicolo riflesso From there, as the trucks haul the material to the primary crusher, you can detect oversize material or contamination and divert the material accordingly. Once at the primary crusher, our Reflex systems can detect oversize material, contamination or give full particle size distribution analysis as the material is dumped. Sistema di analisi del trasportatore singolo After the material has gone through this process our systems can continue to analyze the material on the conveyor belt. At this stage, you can determine what is the most important information you want to retrieve: detect oversize, divert material, identify contaminated material or receive full Particle Size Distribution data 24/7 in real-time. Now, here’s the cool part: our WipFrag software is also the HMI (Human to Machine Interface) for our systems. Not only can you use our software separately to analyze your blast material, but the same software is also used to analyze your material all along its journey from Mine to Mill.
What are the benefits of WipWare products?
Many potential customers ask this very question about the benefits of WipWare products. Well, here’s the answer. WipWare offers industry-leading photoanalysis technology for accurate, real-time fragmentation assessment, optimizing blasting, crushing, and grinding operations. With features like deep learning, auto-scaling, GIS compatibility, and orthomosaic analysis, WipWare ensures precise measurement and continuous improvement. The software’s specification envelope, histogram reporting, and boulder counting enhance decision-making, reducing downtime and costs. Additionally, WipWare provides flexible pricing, cross-shipping warranties, and expert support, making it the top choice for efficient mining and aggregate operations. Furthermore, our online Systems provide data to the customer 24/7 to identify troublesome areas of your process from Mine2mill. In conclusion, our Assolo Basic or Complete, Riflesso Basic or Complete and WipFrag software can drastically lower energy, and maintenance costs, as-well as cut equipment downtime and aid in quality control.
Come funziona la funzionalità volumetrica di WipWare e come può farti risparmiare denaro?
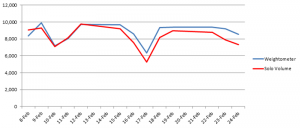
WipWare utilizza precisi laser di rilevamento della profondità del nastro per rilevare entrambi A) Cinghie vuote, come nei precedenti modelli Solo B) La profondità del materiale sul nastro trasportatore When you tie the material depth information with the conveyor belt speed and your belt weightometer reading, you are able to extract the specific gravity of the material passing. Having the specific gravity information will allow you to determine whether the material passing is waste or ore-bearing material. Nei test preliminari presso un'operazione di calcare, WipWare è stato in grado di raggiungere la correlazione 94% tra i calcoli volumetrici e le letture del peso del nastro. Un'operazione potrebbe utilizzare queste informazioni per evitare che il materiale di scarto entri nel processo di frantumazione, risparmiando notevoli quantità di denaro in manutenzione e costi energetici. Volumetrics users have the added benefit of receiving accurate particle sizing results as well as another new feature allowing you to detect contamination. Con i dati di rilevamento di dimensioni, forma, volume e contaminazione trasmessi in streaming senza interruzioni in tempo reale, le tecnologie automatizzate di WipWare forniscono misurazioni dei dati tre volte più accurate rispetto ai concorrenti.
What has WipWare technology been used for?
In WipWare, ci definiamo spesso fornitori di tecnologia mineraria e di aggregazione, poiché questi due settori costituiscono la maggior parte della nostra attività. La bellezza delle tecnologie di fotoanalisi è che con un'immagine adeguata, i nostri prodotti possono analizzare qualsiasi cosa, dai micron ai pianeti. Sappiamo tutti che il dimensionamento automatizzato delle particelle è una parte cruciale dell'industria mineraria e degli aggregati, ma come vedrai, la dimensione del materiale non è importante solo per le rocce. Ecco alcune delle fantastiche applicazioni con cui abbiamo avuto il piacere di lavorare: Marte Curiosity Rover: There may not be any mining on Mars (that we know of), but the Curiosity rover is taking pictures that are being analyzed for oversized obstacle detection. What a great way to identify and steer clear of obstacles and keep Curiosity roaming. Uova strapazzate. That’s right, I said scrambled eggs. A food supplier from the US contacted us looking to optimize the fluffiness and fragmentation of the scrambled eggs they use. I’ll never look at scrambled eggs the same way ever again. Kimberlite lavorata: Getting out of our chef’s apron and putting our hard hats back on, we have been working very closely with multiple diamond companies around the world to accurately analyze the process kimberlite material on their conveyor belts. What’s so incredible about this application? Well, it’s pretty normal, except for the fact that the material ranges from as low as 1.2mm (0.0472440″ for our Imperial friends). Once again, if a suitable image can be captured, WipWare can analyze it. …And of course, we work with hundreds of applications that deal with broken screen detections, contamination, quality control procedures, pre- and post- crusher optimization and SAG mill throughput applications.
How can I see analysis (the) data?
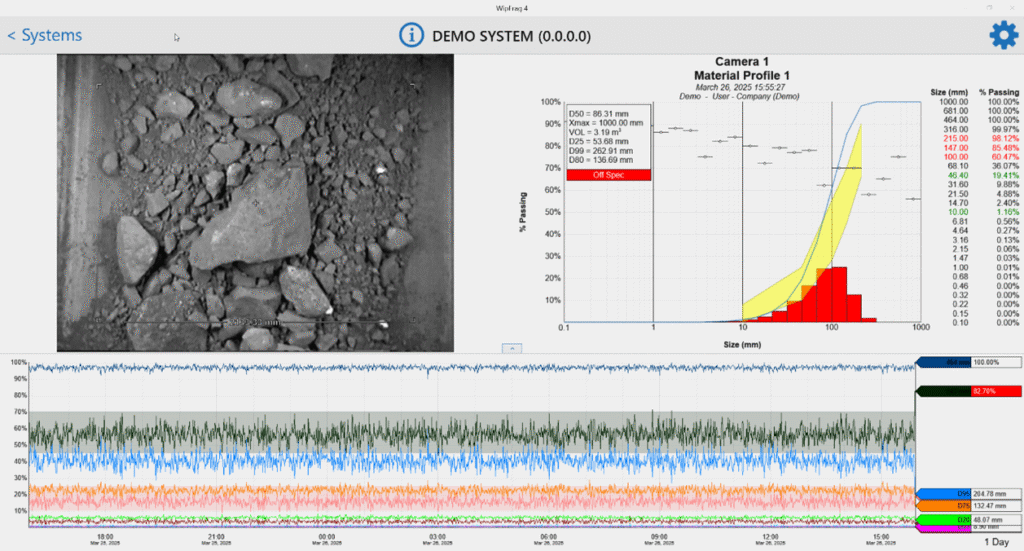
Both Delta (Solo 6 and Reflex 6) and WipFrag produce a percentage passing curve visible after each virtual sieve analysis. It also saves the data to a CSV (comma-separated values) file. Each sieve analysis produces a new line in the CSV file that represents the results from the sieve. Questo file CSV contiene: – Timestamp (Year/Month/Day/Hour/Minute/Second) – D-values (XX% passed the specified size – Ex. 90% of the material passes 13.87 inches[352.30mm]) – User specified size classes (% passing or retained at the specified size) – Block (amount of particle detected) – Min, Max, Mean, St. Dev, Mode – Sphericity (The shape of the material – 0=Linear Objects 1=Perfectly Round) – Coverage (How much of the image is used) – Calibration Values (b, Xmax, X50, Xc and n) – EDP values (Edge Detection Values) – Calibration factors – System info (CPU temp, Board temp, Voltage checks) – System uptime – Camera setting at the time of the image. – Modbus and OPC poll rate – Vehicle Identification Information (Reflex Only) Delta (Solo 6 and Reflex 6) can e-mail these CSV files automatically as well as an average of the entire day on one passing curve. It also has a trending graph in the lower section of the software interface which trends the data for the current day. Inoltre, Delta ha la capacità di emettere le informazioni di analisi utilizzando una connessione Modbus o OPC per passare le informazioni al tuo storico, PLC o HMI.
Quale manutenzione regolare è richiesta per i sistemi di fotoanalisi WipWare?
L'unica manutenzione regolare richiesta per i nostri sistemi è garantire che l'obiettivo e le luci siano puliti con meno polvere/sporco possibile. La frequenza con cui il sistema dovrà essere pulito dipenderà dall'ambiente in cui opera: AMBIENTE/ FREQUENZA Molto polveroso 1-3 settimane Polvere moderata 2-6 settimane Poca o nessuna polvere 4-8 settimane Metodo 1: tubo dell'acqua The first method is the most common. Using a water hose, simply spray down the system ensuring the lens is clean and free of any noticeable dust or dirt. If possible, use a squeegee to remove any droplets that may remain on the lens. Doing this helps prevent dust from collecting in the droplets that remain which could leave deposits on the lens that interfere with image capture. Since our systems are completely waterproof this method is usually the easiest and most effective way to clean the lens. It can also be done without having to shut down the conveyor belt. Metodo 2: panno umido pulito/tovagliolo di carta Un'altra opzione è usare un panno umido pulito o un tovagliolo di carta con acqua o Windex. L'uso di un panno in microfibra pulito sarebbe l'ideale, ma potrebbe essere difficile trovarli nei siti delle miniere. Cerca di non premere troppo forte quando pulisci l'obiettivo, la polvere accumulata potrebbe lasciare graffi nell'obiettivo se viene applicata troppa pressione. Nota: a temperature inferiori allo zero, evitare di utilizzare acqua o Windex poiché si congelerà sull'obiettivo e causerà una qualità dell'immagine inadeguata. Si consiglia di utilizzare un lavacristallo standard valutato per la corretta temperatura sotto lo zero. Metodo 3: aria compressa It’s also acceptable to use compressed air from a can or hose to dust off our systems. This method works well but will kick up a lot more dust than the liquid methods. We recommend using a dust mask when using compressed air to clean off out systems.
Can Delta (Solo 6 and Reflex 6) store the images captured by automated systems?
La risposta semplice è sì. The computer can store up to 1000MB worth of images without any issues. Once beyond this point the hard drive could start having problems accessing the image folder causing the computer to run slower than normal, so the oldest images are overwritten automatically. Nota: tutti i dati sulla dimensione delle particelle sono conservati in un file CSV che è di dimensioni molto più piccole e consente di archiviare i dati su una sequenza temporale più lunga. La maggior parte dei nostri sistemi utilizza una fotocamera da 1,2 MP e le immagini hanno una media di 180 KB ciascuna, quindi 1000 MB di spazio di archiviazione possono contenere circa 5600 immagini. Running 24 hours per day the system can roughly save the following number of images: Se scatti 1 immagine ogni 20 secondi, avresti 4.320 immagini al giorno. ~31,2 ore Se scatti 2 immagini ogni 20 secondi, avresti 8.640 immagini al giorno. ~15,5 ore Se scatti 3 immagini ogni 20 secondi, avrai 12.960 immagini al giorno. ~10,3 ore
When should I apply Calibration to my analysis?
To calibrate, or not to calibrate; that is the question. And it’s an important question to ask prior to installing your online bulk material analysis system, regardless of the industry you’re in. Let’s help you figure out why calibration may or may not be your best bet, and whether you will see value in calibrating your system. Una delle carenze della tecnologia di analisi della frammentazione delle rocce basata su immagini è l'incapacità di analizzare il materiale sottostante che scorre su un nastro trasportatore. Quindi, in circostanze normali, senza calibrazione, il materiale fine è generalmente sottorappresentato quando si utilizza l'analisi delle immagini. La stessa cosa si può dire per l'analisi della frammentazione dell'esplosione, ma ne parlerò un po' più avanti nell'articolo. Se le tecnologie di analisi fotografica rappresentano il materiale sullo strato superiore e sottorappresentano il materiale sottostante, un'operazione può compensare questa carenza calibrando. (Per la guida alla calibrazione, controlla questo link). The way I see it, without sounding too much like a broken record, calibrated photo analysis technologies take the best of both worlds: Quantity and quality. Take the following scenario as an example: Company ABC wants to adjust the SAG feed based on particle size analysis. By doing so, they need to know when to draw fine material from the stockpile and when to draw coarser material. Calibration allows for the proper “mix” of bulk material in order to optimize the process. The Swebrec and Rosin-Rammler functions are great for adjusting the distribution curve to accurately compensate for fine material… But what if you are looking strictly at the coarse sizes, say, for oversize detection? If this is the case, you may want to reconsider the calibration process. Allow me to explain: A calibrated system is making certain assumptions about material underneath the top layer and may even bias your coarse material fractions when trying to adjust the distribution curve. So, if you are planning on having a conveyor belt shut down if it detects material over x size, you may want to reconsider taking the chance of biasing your results. Instead, an uncalibrated system is going to get you very useful data that will allow you to stop/start/act on out-of-spec readings and optimize your process. What are other reasons why clients don’t calibrate? Quando il materiale è troppo grande, è molto più difficile campionare manualmente il materiale e questo potrebbe essere proibitivo in termini di costi. Questo problema si verifica più spesso all'estremità della sabbiatura dell'applicazione, dove l'ottimizzazione della sabbiatura si basa molto sul rilevamento dei cambiamenti relativi nelle dimensioni del materiale. Per l'analisi post-frantumatore, alcuni clienti rilevano l'usura del liner a causa di aumenti relativi delle dimensioni del materiale, rendendo quindi superflua la calibrazione. In sintesi, la calibrazione ha certamente i suoi usi all'interno delle industrie minerarie e degli aggregati, e più specificamente, quando le dimensioni dei materiali più fini sono una parte necessaria del dilemma; tuttavia, i sistemi non calibrati sono ancora molto utili per ottimizzare il processo e per tenere traccia dei relativi cambiamenti.
What is WipWare’s warranty policy?
WipWare Inc. provides a one-year limited warranty on all products, including components and software. To offer customers peace of mind, WipWare also offers an annual service contract, which includes exclusive technician service rates, monthly check-ins, extended system warranties, and more. With the purchase of any WipWare photoanalysis product, the warranty covers cross-shipping for any defective product under the WipWare Limited Warranty, ensuring minimal downtime for customers. Per i dettagli completi sulla garanzia limitata WipWare, vedere qui.
In che modo WipWare facilita la formazione per i suoi prodotti unici?
WipWare goes above and beyond to ensure that not only customers, but any individual or company who may show interest in a WipWare product has the utmost training and confidence when it comes to utilizing our extensive line of photoanalysis systems. WipWare offers free training to individuals, companies, colleges, and universities interested in learning about our products. We recently conducted on-campus workshops for mining students at Queen’s University (Kingston), Laurentian University (Sudbury), and ÉTS University (Montreal). In addition to in-person sessions, we provide virtual training and have a library of training videos available for easy access. For more information about WipWare training please contact support@wipware.com
For more information about our systems, please visit our YouTube channel.
Utilizziamo i cookie sul nostro sito Web per offrirti l'esperienza più pertinente ricordando le tue preferenze e ripetendo le visite. Cliccando su "Accetta", acconsenti all'uso di TUTTI i cookie.
Questo sito Web utilizza i cookie per migliorare la tua esperienza durante la navigazione nel sito Web. Di questi, i cookie classificati come necessari vengono memorizzati nel browser in quanto sono essenziali per il funzionamento delle funzionalità di base del sito Web. Utilizziamo anche cookie di terze parti che ci aiutano ad analizzare e capire come utilizzi questo sito web. Questi cookie verranno memorizzati nel tuo browser solo con il tuo consenso. Hai anche la possibilità di disattivare questi cookie. Ma la disattivazione di alcuni di questi cookie potrebbe influire sulla tua esperienza di navigazione.
I cookie necessari sono assolutamente essenziali per il corretto funzionamento del sito web. Questi cookie garantiscono funzionalità di base e caratteristiche di sicurezza del sito web, in modo anonimo.
Cookie
Durata
Descrizione
cookielawinfo-checbox-analytics
11 mesi
Questo cookie è impostato dal plug-in di consenso sui cookie GDPR. Il cookie viene utilizzato per memorizzare il consenso dell'utente per i cookie nella categoria "Analytics".
cookielawinfo-checbox-funzionale
11 mesi
Il cookie è impostato dal consenso cookie GDPR per registrare il consenso dell'utente per i cookie nella categoria "Funzionali".
cookielawinfo-checbox-others
11 mesi
Questo cookie è impostato dal plug-in di consenso sui cookie GDPR. Il cookie viene utilizzato per memorizzare il consenso dell'utente per i cookie nella categoria "Altro.
cookielawinfo-checkbox-required
11 mesi
Questo cookie è impostato dal plug-in di consenso sui cookie GDPR. Il cookie viene utilizzato per memorizzare il consenso dell'utente per i cookie nella categoria "Necessario".
cookielawinfo-checkbox-performance
11 mesi
Questo cookie è impostato dal plug-in di consenso sui cookie GDPR. Il cookie viene utilizzato per memorizzare il consenso dell'utente per i cookie nella categoria "Prestazioni".
viewed_cookie_policy
11 mesi
Il cookie è impostato dal plug-in GDPR Cookie Consent e viene utilizzato per memorizzare se l'utente ha acconsentito o meno all'uso dei cookie. Non memorizza alcun dato personale.
I cookie funzionali aiutano a eseguire determinate funzionalità come la condivisione del contenuto del sito Web su piattaforme di social media, la raccolta di feedback e altre funzionalità di terze parti.
I cookie sulle prestazioni vengono utilizzati per comprendere e analizzare gli indici di prestazioni chiave del sito Web che aiutano a fornire una migliore esperienza utente per i visitatori.
I cookie analitici vengono utilizzati per capire come i visitatori interagiscono con il sito web. Questi cookie aiutano a fornire informazioni sulle metriche del numero di visitatori, frequenza di rimbalzo, sorgente di traffico, ecc.
I cookie pubblicitari vengono utilizzati per fornire ai visitatori annunci e campagne di marketing pertinenti. Questi cookie tracciano i visitatori sui siti Web e raccolgono informazioni per fornire annunci personalizzati.