A Quick Summary on WipFrag version 4 and its New Features
Overview
Mining is the extraction of valuable materials called ore or sometimes industrial minerals from the earth crust, using appropriate technology with the aim to provide raw materials for industrial use.
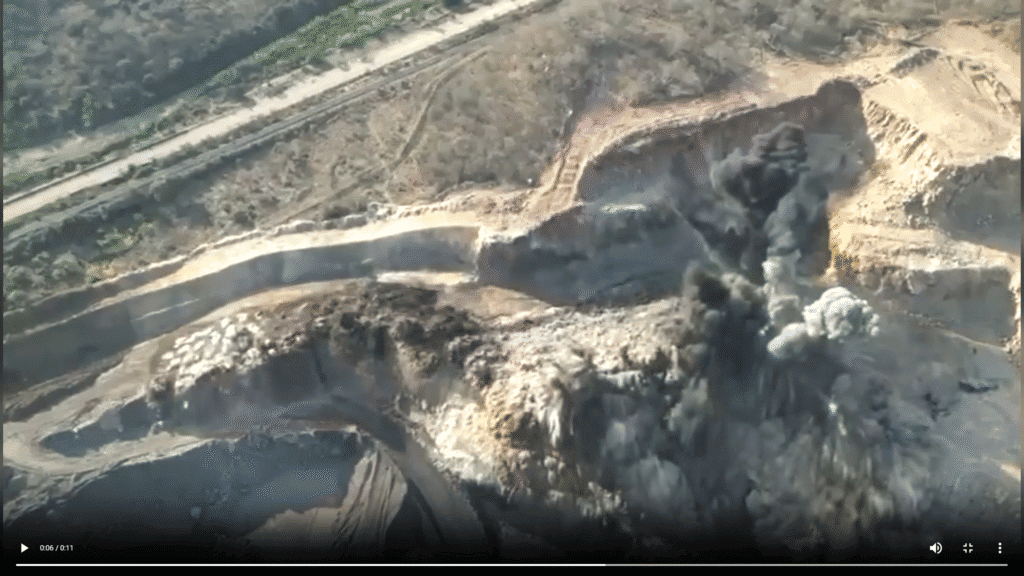
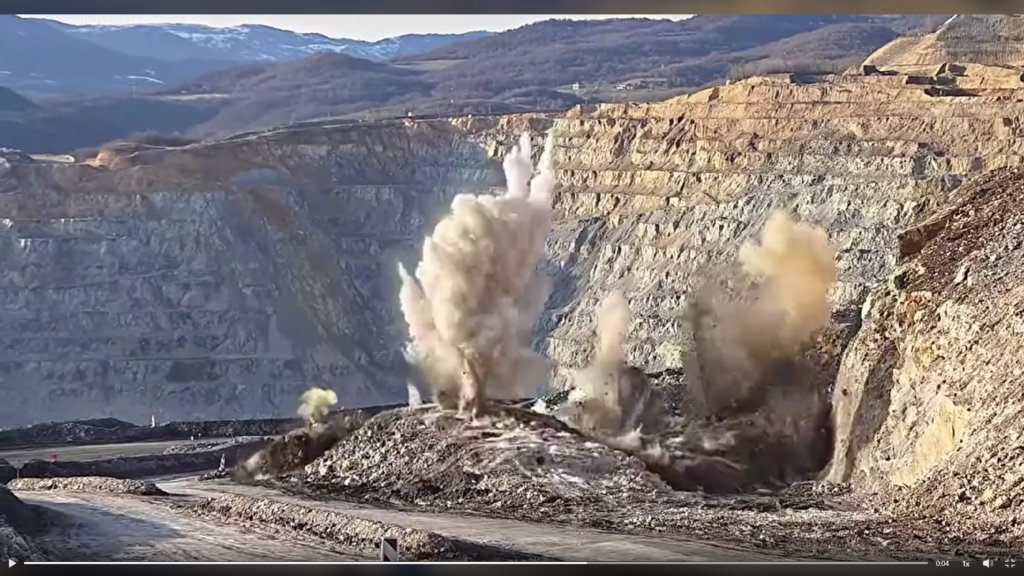
The materials exist in massive form and must therefore be broken into handable size through blasting operation or other safe and productive ways. The use of explosive to break rock into smaller sizes had been adopted several years due to it well know advantages.
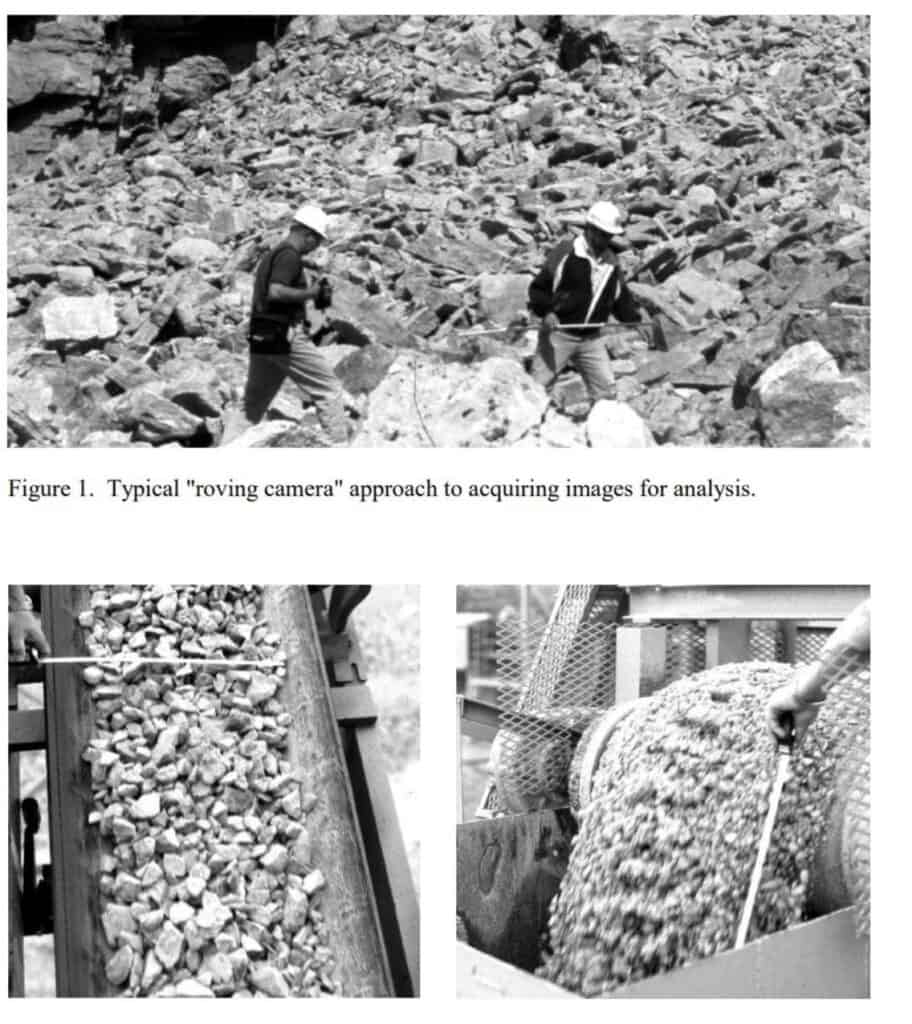
Image analysis had been proven as the way forward to enhancing blasting and improving downstream operation efficiency through accurate visualization. Image analysis is a technique use to evaluate blasting output and to monitor material flow during mineral processing.
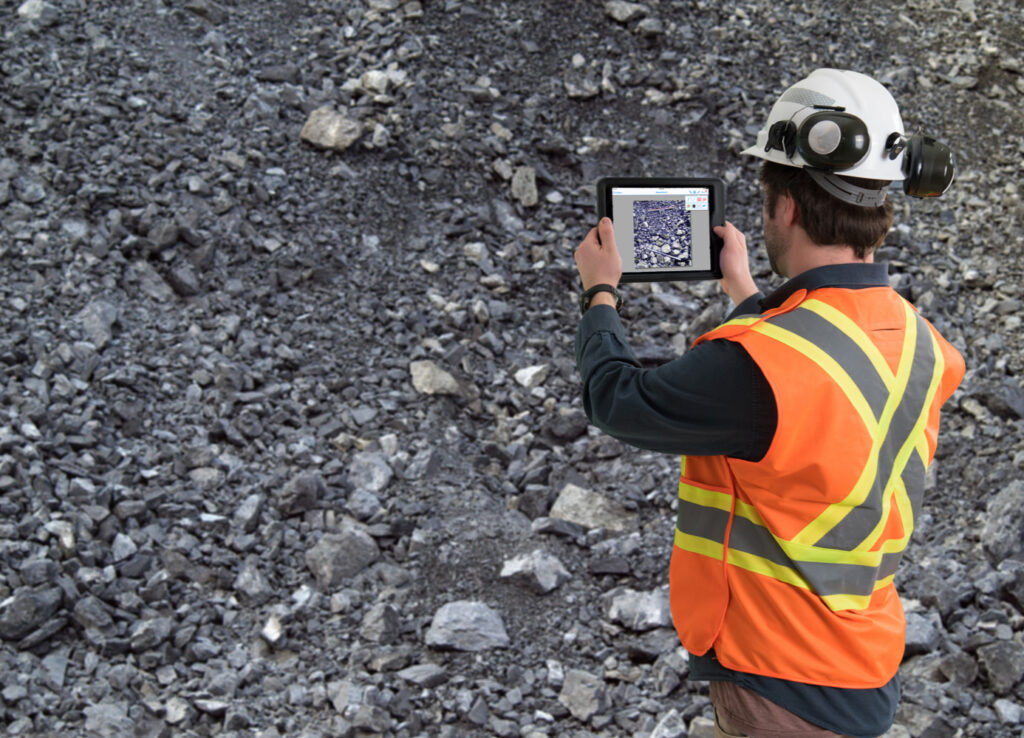
WipFrag Image Analysis software is a powerful tool for analyzing particle size distribution (PSD) in digital images collected from various blast muck-pile, including fresh phase muckpiles after blasts, time series stockpile samples, and even drone or UAV images.
Features and Advantages
Let’s delve into its features and advantages:
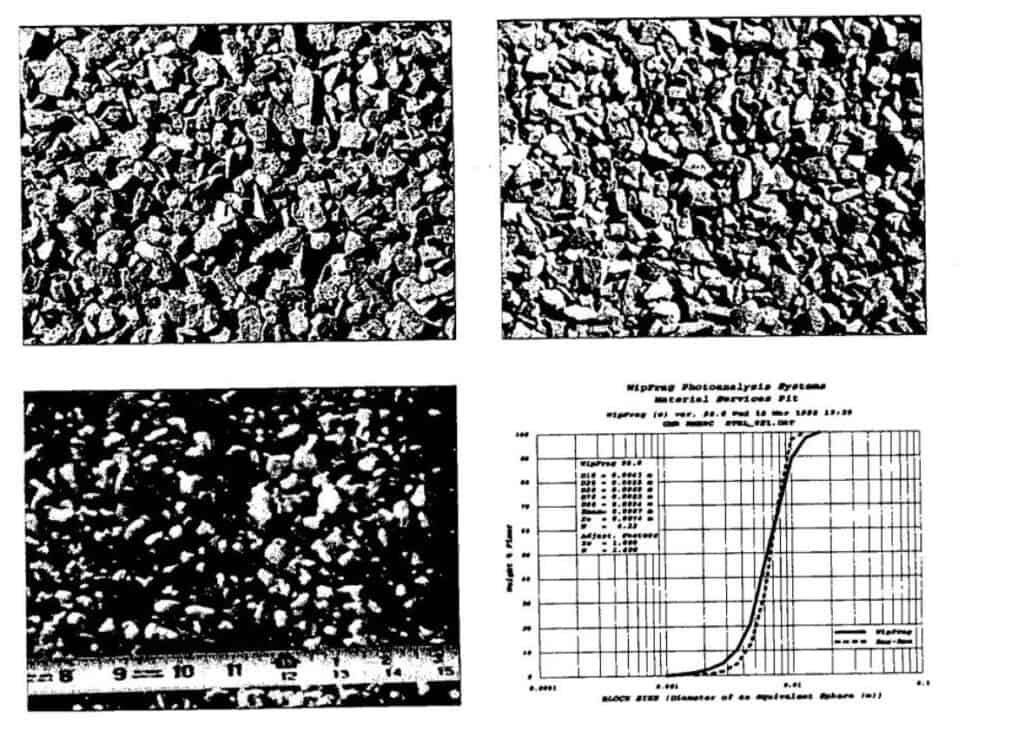
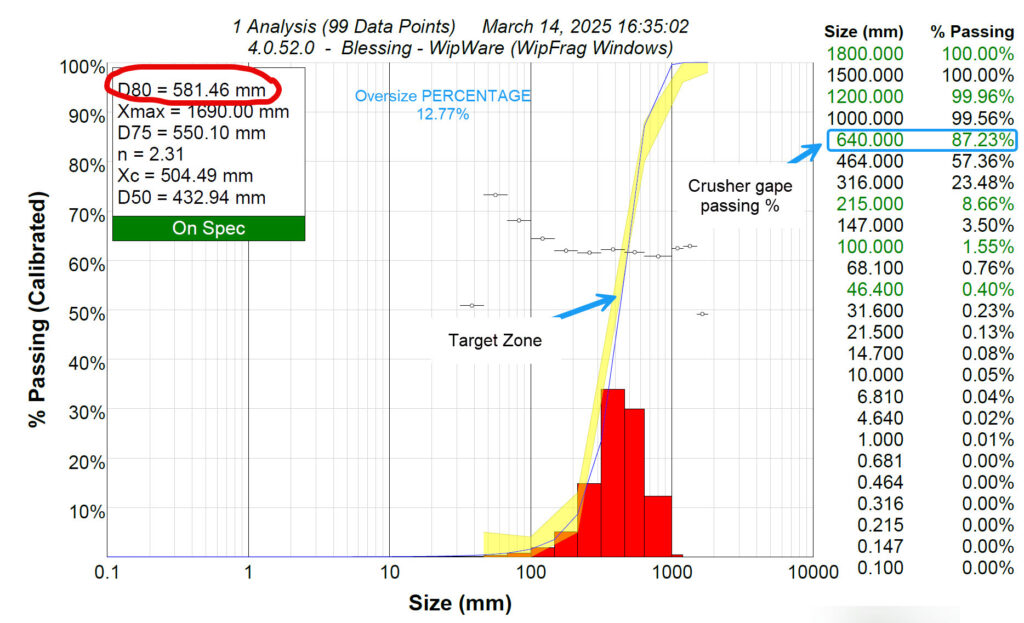
1. Instant PSD Analysis: WipFrag 4 provides instant PSD analysis of the captured images. Whether you’re assessing post-blast muckpiles or analyzing stockpile samples, this software delivers accurate fragmentation data.

2. Auto-Scaling Capabilities: With auto-scaling capabilities, WipFrag 4 ensures precise measurements. It’s a cost-effective solution that saves time and resources.
3. Cross-Platform Compatibility: Seamlessly analyze images across multiple platforms, including iOS, Android, and Windows. Share results effortlessly and optimize blast performance.
4. BlastCast Blast Forecast Module: This module, included in the software, helps predict fragmentation when used alongside WipFrag particle size data. It’s a valuable tool for blast planning.
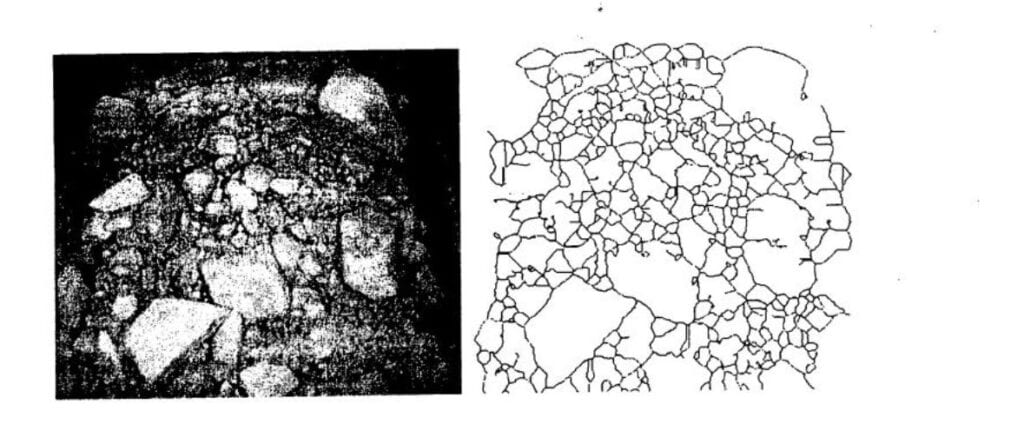
5. Deep Learning Edge Detection: This amazing tool will increase accuracy from our previous Simple edge detection and almost eliminate the need to manually edit your images.
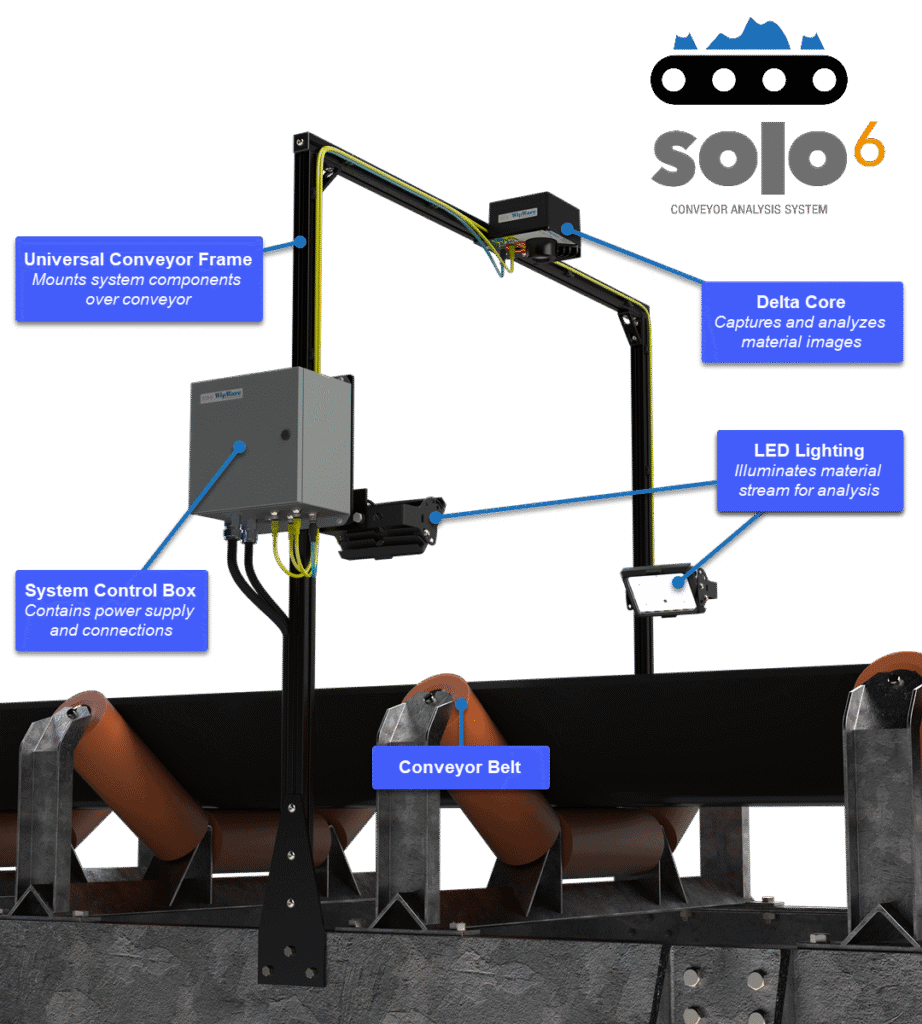
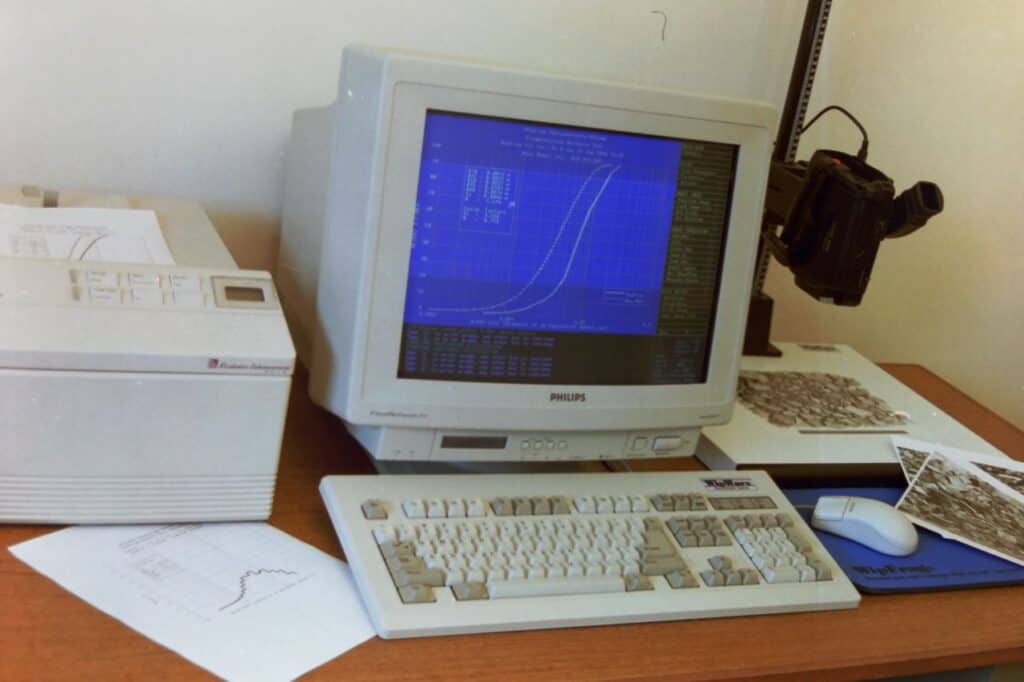
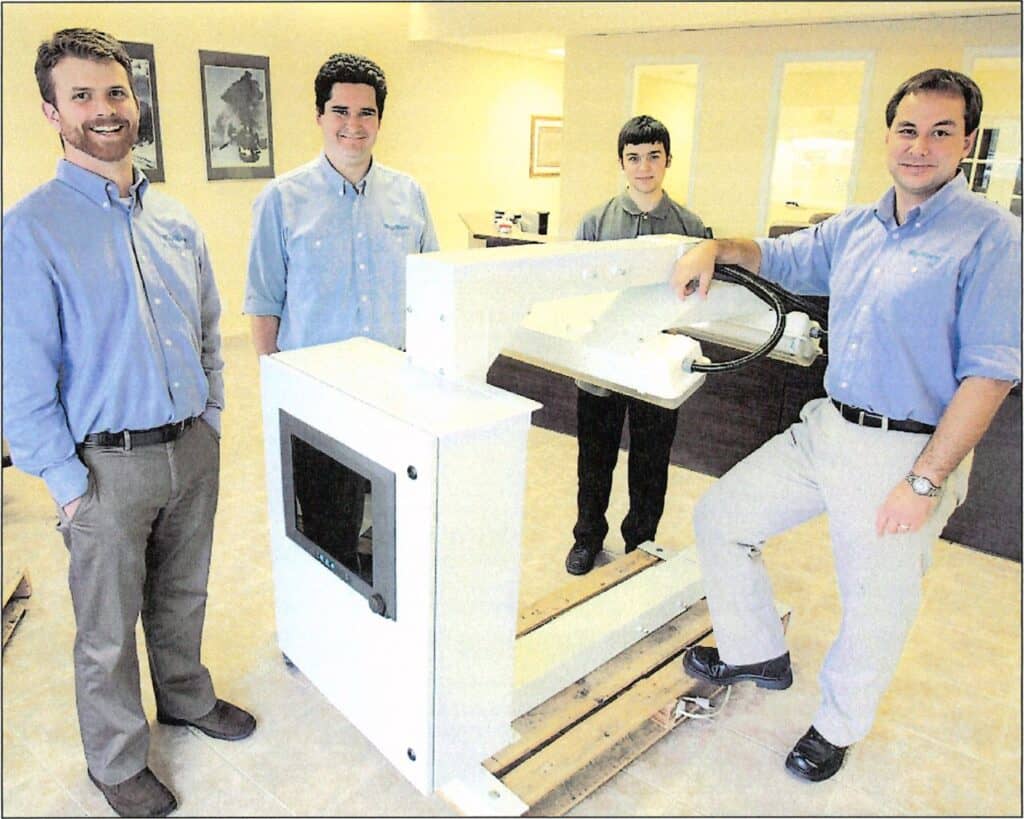
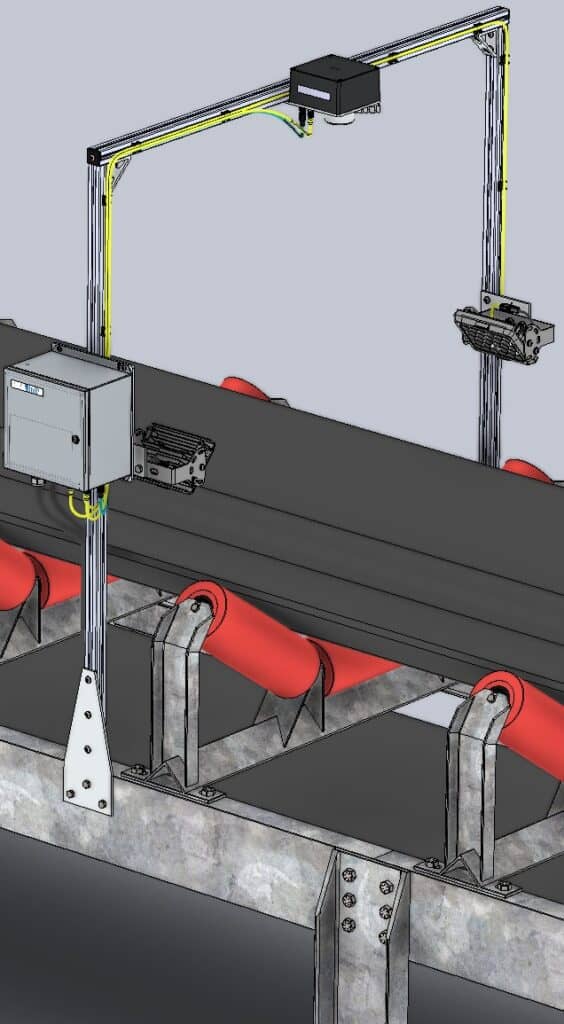
6. Integration with WipWare Photoanalysis Systems: WipFrag 4 also controls sixth-generation WipWare Photoanalysis Systems. Monitor conveyor belts or heavy-duty vehicles in real time, providing continuous particle size data to your portable device 24/7.


WipFrag Software Options Available
WipFrag 4 offers flexible licensing options to suit different operational needs, whether you require continuous blast fragmentation analysis or occasional assessments. Here’s a quick overview of what’s available:
1. Annual Subscription
Ideal for operations requiring consistent fragmentation analysis, the annual subscription allows up to 10 simultaneous device activations per license. This is a cost-effective solution for teams working across multiple sites or needing frequent analysis.
2. Pay-Per-Use (PPU) Option
For users who need WipFrag on a project basis or for occasional assessments, the PPU image credit is a great option. This model offers flexibility, enabling you to pay only when you use the software without committing to an annual plan.
3. UAV/Orthomosaic Image Analysis:
This is included in the annual subscription with unlimited analyses for the year. If credits are preferred, a minimum of 3 credits is required to unlock the analysis results. Number of credits is determine by hectare.
4. MailFrag Single or UAV/Orthomosaic Image Analysis:
MailFrag is our online service when customers need a third party to analyze their images. Single image analysis is 3 credits and UAV/Orthomosaic image analysis is a minimum of 9 credits based on hectare. MailFrag is only available for use with credits. It is not included as an option with the annual subscription.

Which License is Right for You?
If you’re unsure which license best fits your needs, contact us to discuss your application and explore the best solution for your operation. Whether you need continuous monitoring or occasional analysis, WipFrag has an option that works for you!
Remember that credits can be transferred to other WipWare Account users. Additionally, UAV/orthomosaic images must be analyzed with the Windows version and be in GeoTIFF format.
In summary, WipFrag 4 offers a cost-effective and accurate solution for fragmentation analysis, making it an essential tool for professionals in various industries.
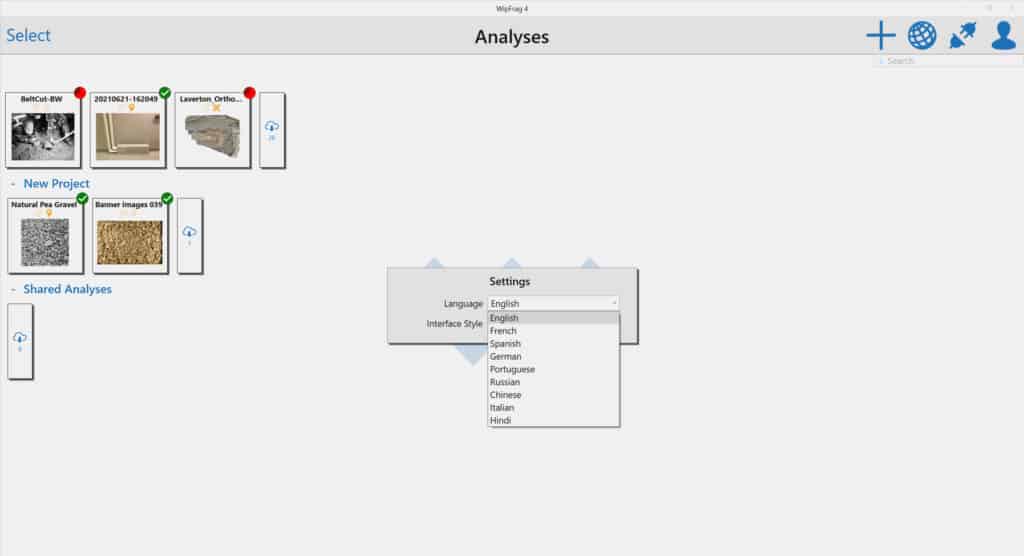
Multiple Language Options
WipFrag 4 has multiple language options available for our customers. The following nine languages are now available:
Inglese, francese, spagnolo, tedesco, portoghese, russo, cinese, italiano e hindi.
Per modificare la preferenza della lingua in WipFrag 4, segui questi passaggi:
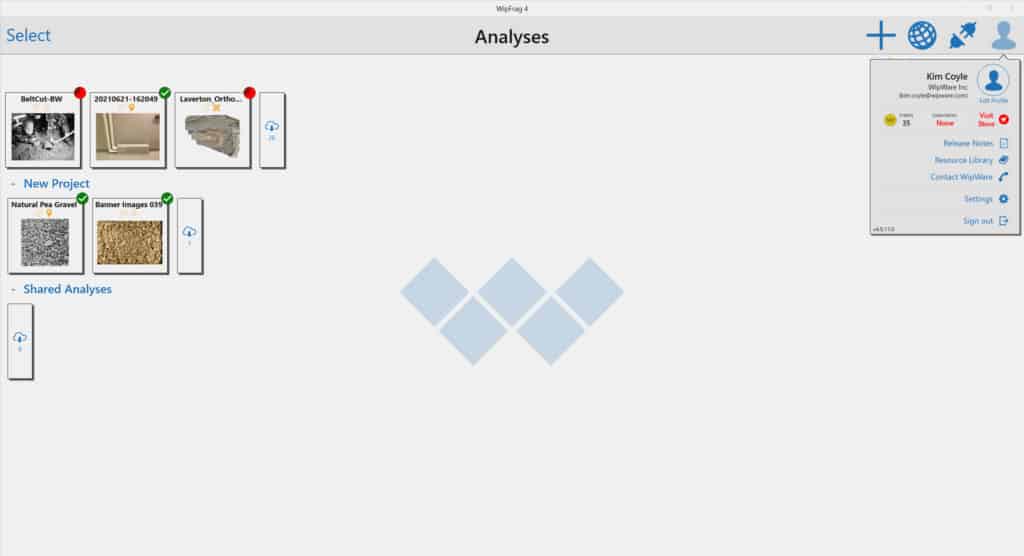
Click on your Profile Icon
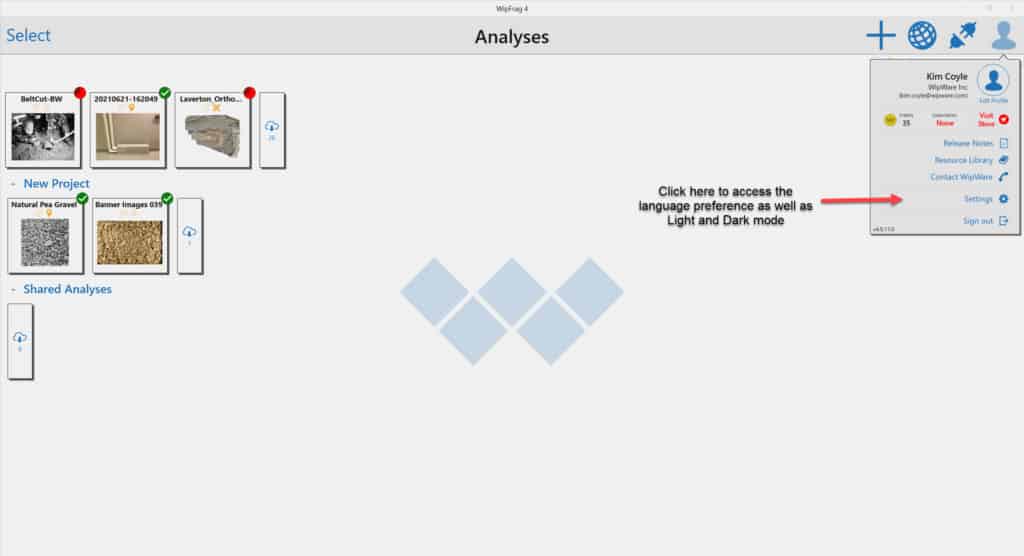
Fare clic sul pulsante Impostazioni
In Settings, click on Language to access the drop-down menu
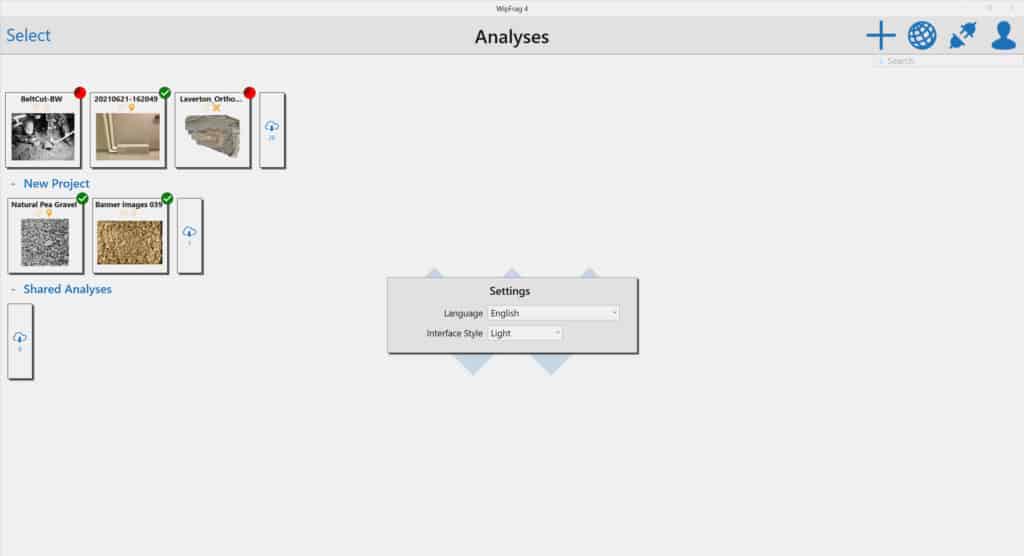
Nel menu a discesa sono disponibili 9 opzioni di lingua
Per ulteriori informazioni sul nostro software di analisi delle immagini WipFrag 4, visitare il nostro Pagina WipFrag.