Every operation has a specification they need their material size to be within: Whether it’s ASTM specifications for aggregate operations, key performance indicators for crushers and SAGs, or blast metrics for explosives selection, these standards are crucial in streamlining an operation’s process.
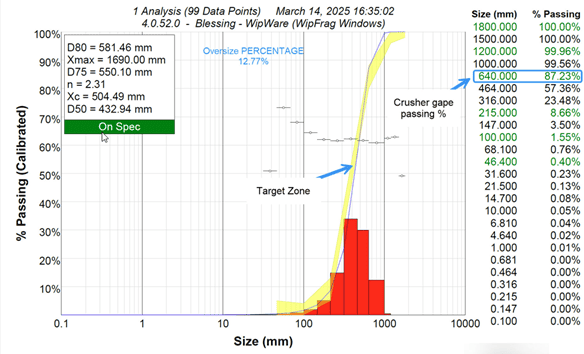
For example: an operation in northern Quebec, Canada (if you are looking at a map of Quebec, chances are you are still not looking north enough… keep going… there you go) needed to ensure material size did not exceed 6 inches in size coming out of the primary crusher, for a variety of reasons:
Die Energie, die stromabwärts benötigt wurde, um diese großen Partikel abzubauen, war erheblich
Wartungsprobleme in Bezug auf Schäden durch diese übergroßen Partikel
Getting maintenance personnel on-site to deal with the points was extremely costly
With the assistance of Xstrata Process Support (XPS) and a hydraulic toggle supplier, WipWare was able to not only identify when material was larger than 6″ but send signals to through a PLC that would automatically adjust the crusher mantle to bring the material size back in line. Just by reducing maintenance shutdowns to manually adjust the crusher setting, this operation was able to recoup the cost of the system within a year.
Even if your operation opts to manually adjust its process using WipWare’s systems as a guide, the benefits are widespread and significant. We’ve seen the timeline between liner replacements expanded drastically, and SAG feed optimized on-the-fly by utilizing online data as a standard.
…And for the folks who have dealt with paving specifications, all it takes is for a half mile of out-of-spec pavement to be pulled up to identify the importance of keeping material in between the goal posts.
Speaking more on the ground level of photoanalysis technology, envelopes can be created inside of WipFrag und Solo, so operators can identify out-of-spec material briefly. Perhaps it’s a matter of notifying mining personnel, or shutting down a belt until liner maintenance is completed; regardless, having a tool that can help significantly in adhering to your operation’s standards can mean cost-savings, reduced downtime, and a more proactive approach to mining and milling.
WipWare has been in the image analysis business for over 30 years commercially. We’ve seen a wide range of mining and aggregate sites, all with their unique challenges. One thing that stays consistent with every operation is the need to reduce particle sizes to ideal sizes for either the extraction of minerals, or for more practical uses (road building, etc.)
Blasting, crushing and grinding material down to an optimal size is difficult to do. When you tie in trying to be efficient at the same time, production rates can fluctuate quite easily. It’s very hard to track how well the ‘rock breaking’ is going.
Warteschlangensiebung!
Manuelles Sieben gibt es schon seit Tausenden von Jahren. Heutzutage ist die Genauigkeit dieser Siebanalysemethoden beeindruckend: Band anhalten, Schnitt machen, Material ins Labor bringen, in die Siebmaschine geben und fertig! In wenigen Stunden hast du dein Ergebnis. Was wäre besser?
Well, let’s back it up a little and investigate. Manual sieve samples are very accurate for the sample itself. However, if you use manual sampling to track, say, relative changes, you are putting a lot of faith in that one belt cut of material representing hundreds/thousands of tons of material.
Manual Sieving vs Continuous Monitoring
You may notice why WipWare systems are really taking a hold in the mining and aggregate industries: No one will ever argue that a manually sieving a sample is not accurate; but here is a scenario I want you to consider:
You take a sample of a 1-meter belt cut every shift for analysis. When the crusher supplier asks for the material size going into the secondary crusher, you hand him/her the beautiful distribution curves with the data points in the Excel file. Based on the data, he/she decides “based on your material size, you need this kind of crusher/liner/product”.
Do those manual samples accurately represent the hundreds or thousands of tons passing through your process? What if the sample you took happened to be finer than what was typical? Chances are, as granulometry guru Jack Eloranta, of Eloranta & Associates calculates, misrepresentation could be possible.
Take a look:
Annehmen:
400 TPH
6 m/s
1 Meter Bandprobe pro Schicht
Band bewegt sich 1 Meter in 0,17 Sekunden
0,17 Sek. x 1 Std./3600 Sek. x 400 t/Std. = .019 Tonnen
0,019 t/(8 x 400) t = 0,0000059
Really, when you look at how representative a manual sample is, you are looking at 0.00059% of your conveyor material in this example.
With a percentage like that, I’ll take continuous, non-disruptive particle sizing any day.
So let’s summarize so far: Manual sieving accurately measures the sampled material but may not represent the material continuously running through your process.
What’s WipWare’s role in all of this?
Well, it’s really a complementary thing. WipWare is the ying to sieving’s yang, the Sunny to sieving’s Cher…I’ll stop now.
WipWare’s systems offer continuous monitoring of material. That’s right. 24/7/365 analysis of the most important part of the mining process; the whole reason billions upon billions of dollars are spent each year; the reason why mine and mill employees have a love/hate relationship – the size of material! Manual sieve results can be tied into the WipWare data using Rosin-Rammler or Swebrec functions, covering both the quantity of data needed for accurate analysis, with the quality manual sample information.
WipWare’s systems offer continuous monitoring of material. That’s right. 24/7/365 analysis of the most important part of the mining process; the whole reason billions upon billions of dollars are spent each year; the reason why mine and mill employees have a love/hate relationship – the size of material! Manual sieve results can be tied into the WipWare data using Rosin-Rammler or Swebrec functions, covering both the quantity of data needed for accurate analysis, with the quality manual sample information.
Optimizing Blast Predictions with BlastCast in WipFrag
Predicting blast fragmentation is a complex process influenced by numerous variables and uncertainties. Achieving optimal fragmentation is essential for controlling costs and enhancing operational efficiency.
BlastCast, an advanced blast fragmentation prediction module integrated into WipFrag-Software, provides a valuable tool for improving blast outcomes. Available as a free enhancement, BlastCast works alongside WipFrag data to help users forecast fragmentation and make necessary adjustments to achieve desired results.
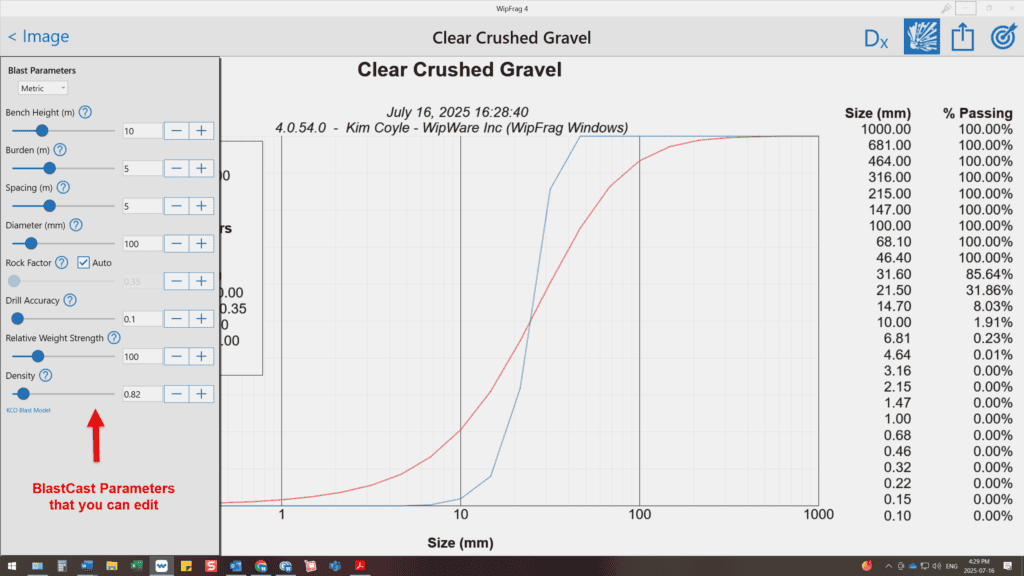
How BlastCast Works
To begin, users input blast parameters, and BlastCast generates a predicted particle size distribution graph. After executing the blast, WipFrag measures the actual fragmentation. The results can be dragged into the BlastCast window, overlaying actual fragmentation over the predicted graph. By adjusting the Rock Factor slider, users can fine-tune the prediction model to align with real-world results.
Once calibrated, the model enables users to test different blast parameter adjustments, such as spacing or burden, to assess their impact on fragmentation. Over time, continued use of BlastCast enhances prediction accuracy, leading to better-controlled blasts.
Key Features & Parameters in BlastCast
Size Class Settings: Matches WipFrag’s Output Options.
Metric/Imperial Units: Allows users to select preferred measurement systems.
Blast Values Checkbox: Locks the rock factor section to simulate the unknown rock condition using KCO model.
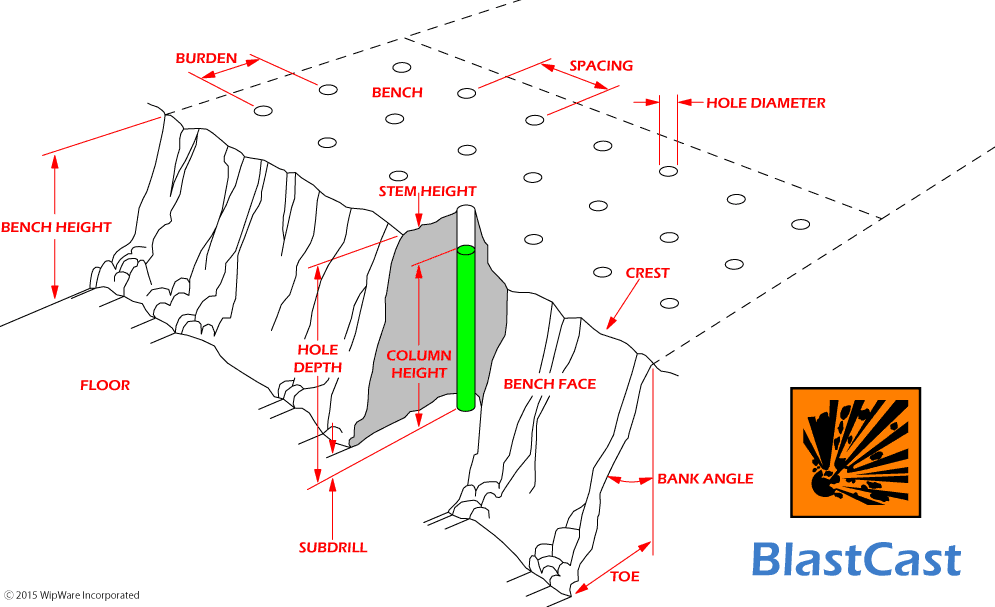
Burden & Spacing: Determines borehole placement for efficient breakage.
Drill Accuracy: Accounts for deviations in borehole alignment.
Bench Height: Specifies the height of the face being blasted.
Explosive Density & Strength: Pulls specifications from manufacturers to assess explosive performance.
Rock Factor: The most challenging parameter to determine, considering multiple geological properties affecting blast results.
Why Use BlastCast?
By integrating BlastCast into your blasting workflow, you can fine-tune designs, optimize fragmentation, and improve cost efficiency. Whether adjusting spacing, burden, or explosive selection, BlastCast helps you make data-driven decisions for better blast outcomes.
Want to see BlastCast in action? Kontaktiere uns for a demo!
WipWare
Fragmentation Analysis Software That Expands Your Life-of-Mine Vision
Fragmentation analysis is a critical driver of mine performance, profitability, and sustainability. Accurate measurement and control of rock fragmentation from drill and blast to crushing and milling directly influence throughput, energy consumption, equipment wear, and operating costs.
WipWare’s fragmentation analysis solutions use advanced image processing and AI-driven technologies to deliver high-quality, real-time particle size distribution (PSD) data. This enables mining operations to optimize processes across the entire value chain, from pit to plant, while maximizing life-of-mine value.
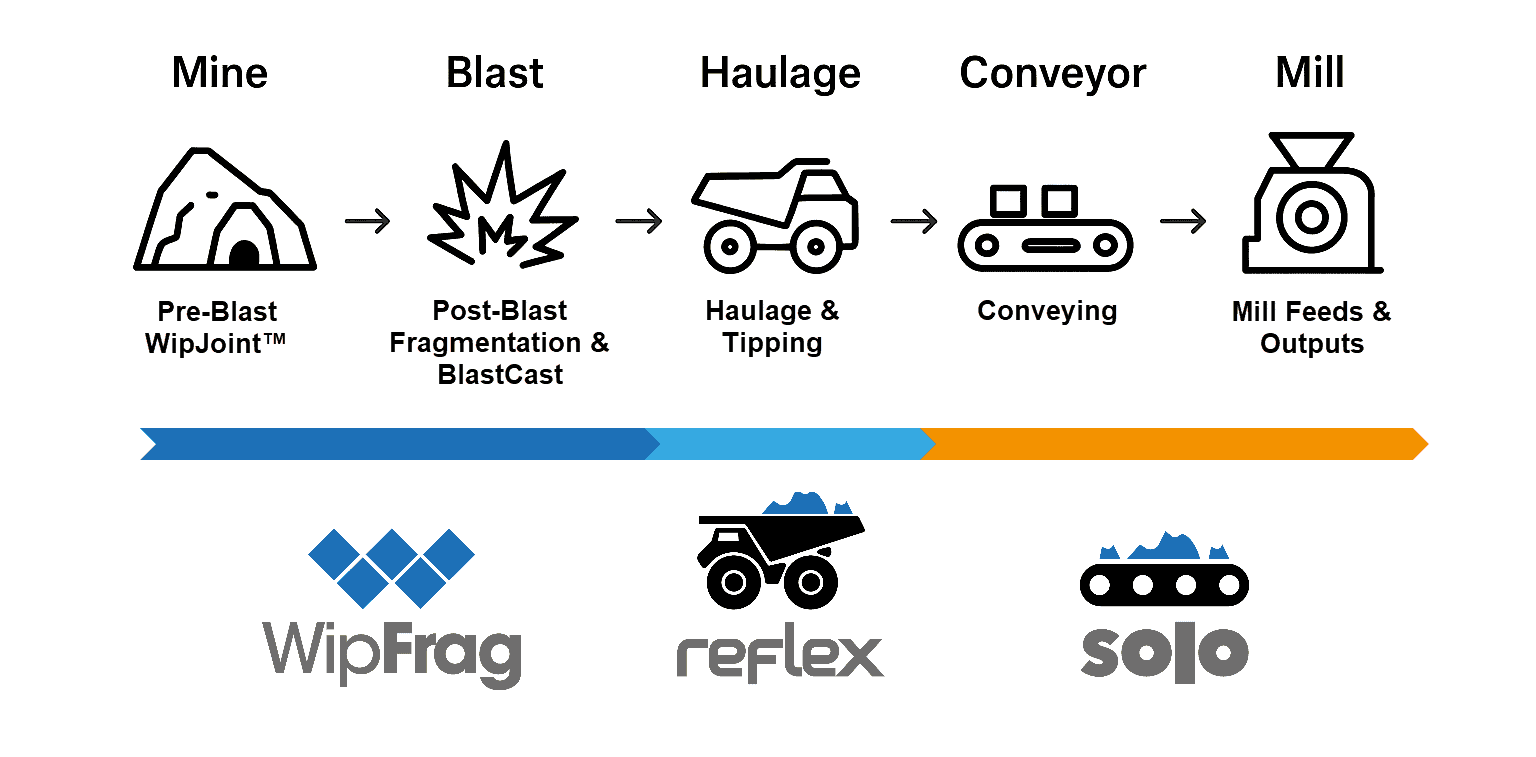
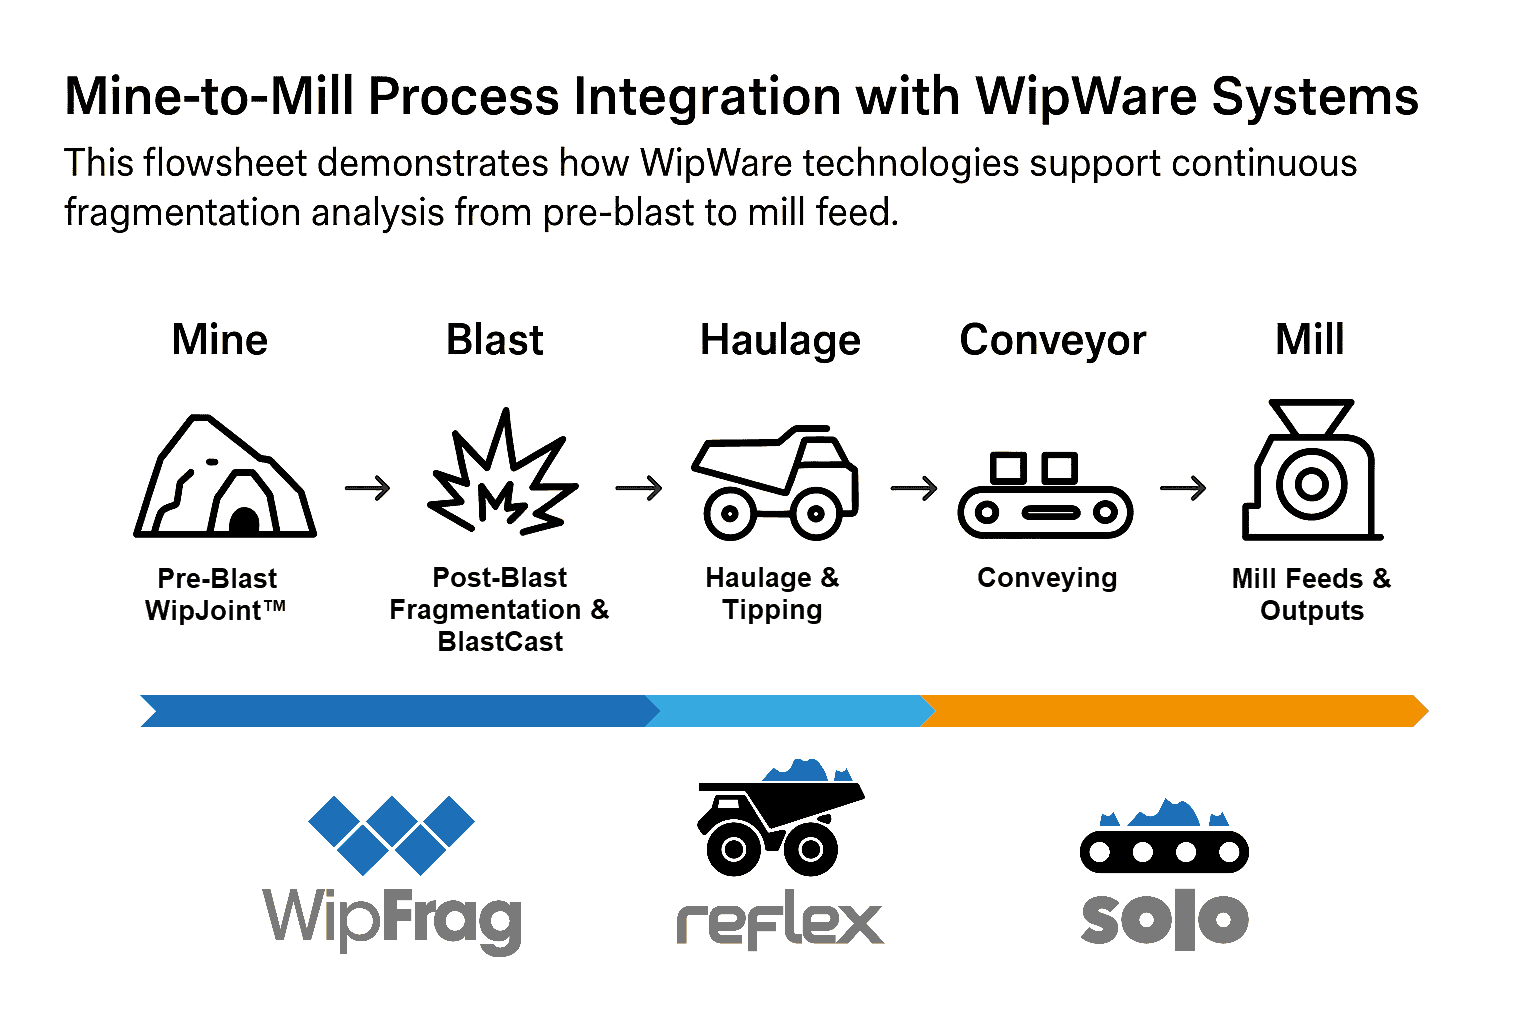
End-to-End Fragmentation Analysis: From Drill to Mill
WipWare provides a fully integrated fragmentation monitoring ecosystem, offering consistent, accurate PSD measurement at every stage of material handling. By connecting blasting performance with crushing and processing outcomes, operations gain unmatched visibility and control over their production system.
Online Conveyor Belt Fragmentation Measurement – Solo 6
Solo 6 delivers continuous, online particle size distribution analysis for conveyor belts across the comminution circuit, including:
Primary crushers
Secondary and tertiary crushers
Pebble crushers
Screen decks
With real-time fragmentation data at any conveyor belt location, Solo 6 allows operators to quickly detect changes in feed size, optimize crusher settings, and maintain consistent plant performance.
Real-Time Pit-to-Plant Fragmentation Control – Reflex 6
Reflex 6 measures the particle size distribution of post-blasted rock as it is delivered to the primary crusher, Bin and Stockpile. This real-time monitoring capability ensures effective management of the critical transition from pit to plant, reducing variability, minimizing crusher blockages, and improving overall throughput.
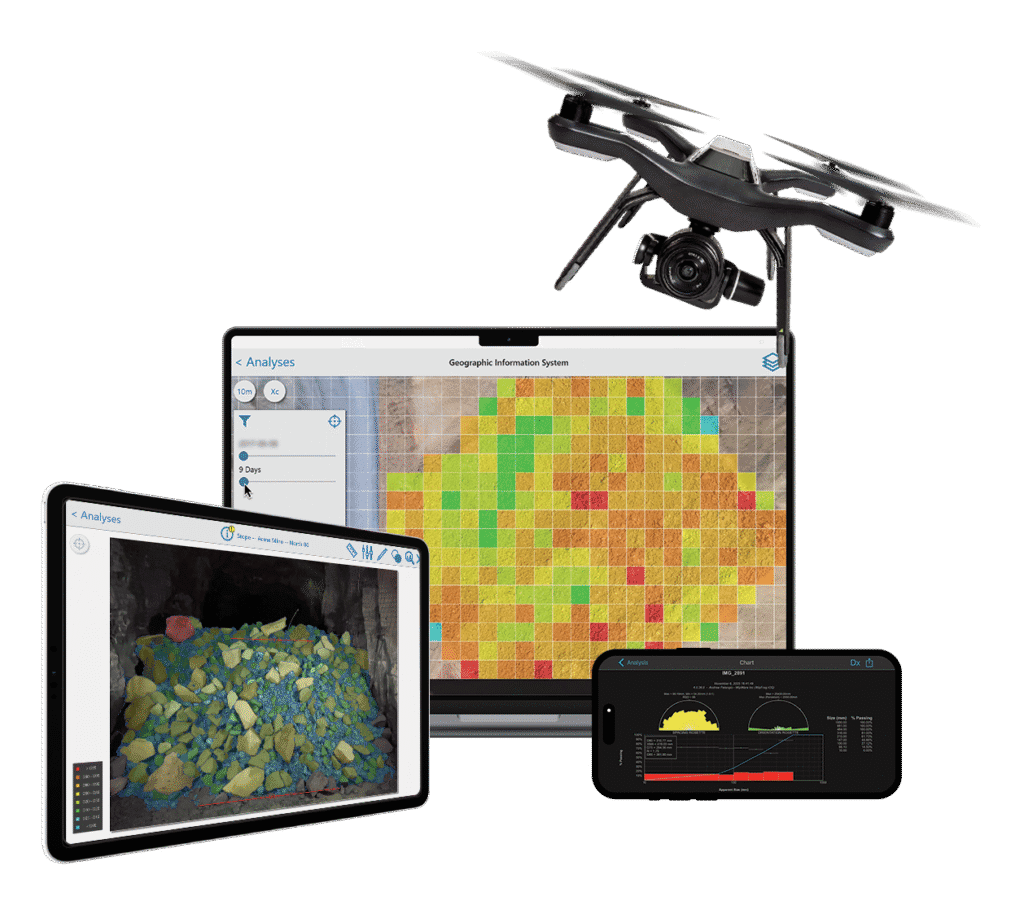
In-Pit Fragmentation Analysis – WipFrag 4
WipFrag is the standard industry solution for post-blast fragmentation analysis in open pit and underground mines. It enables engineers to accurately quantify particle size using:
Mobile phones
PCs
Drones (UAVs)
WipFrag provides fast, reliable fragmentation assessments directly in the pit, supporting blast design validation, performance benchmarking, and continuous improvement.
Outsourced Fragmentation Analysis – MailFrag
MailFrag is a service that offers a simple and efficient solution for teams who like to get results with the help of WipWare in-house image processing specialists. By leveraging WipWare’s experienced analysts, MailFrag delivers professional fragmentation size distribution reports, allowing operations to focus on decision-making rather than data processing.
AI-Based Geotechnical Analysis – WipJoint
WipJoint, a powerful feature within WipFrag, extends value beyond fragmentation by applying AI imaging technologies to geotechnical analysis. It supports the identification and characterization of rock mass structures, joints, and discontinuities, contributing to safer blast design and improved rock mass understanding.
BlastCast enables predictive fragmentation modeling using the Swebrec distribution, allowing engineers to simulate blast outcomes before execution. This supports:
Optimization of blast design
Reduction of oversize and fines
Alignment of fragmentation with plant requirements
Simulation-driven planning leads to improved consistency, lower costs, and better downstream performance.
Why Fragmentation Analysis Is Critical to Mine Profitability
By integrating measurement, analysis, and simulation, WipWare’s fragmentation solutions transform raw images into actionable intelligence. This holistic approach improves safety, increases productivity, reduces energy consumption, and aligns pit-to-plant performance.
Fragmentation analysis doesn’t just measure rock; it drives smarter mining decisions across the entire life of mine.
Reflex
Evaluating Rock Comminution Pre-Blast to Post-Blast and Through Mineral Processing
The Need for Energy Efficiency Assessment in Blasting
In today’s mining and quarrying operations, energy efficiency remains one of the most pressing challenges. Blasting, being the first step in the comminution process, consumes a significant portion of total energy in mineral production. Yet, the true measure of blasting efficiency is not merely how rock is broken, but how well the resulting fragmentation supports downstream processes such as crushing and grinding.
A tool is therefore needed to assess and quantify the energy utilization in blasting, specifically through fragmentation analysis. By analyzing fragmented rock sizes in terms of percentage passing, engineers can evaluate how effectively a particular blast design converted explosive energy into rock breakage. Since controllable parameters such as burden, spacing, charge distribution, and initiation timing govern how explosive energy is distributed within the rock mass, understanding fragmentation helps determine how these parameters interact with uncontrollable factors like rock structure and discontinuities.
WipWare: The Global Ruler for Rock Size Assessment
WipWare Inc. is well known as the world leader in rock size measurement and fragmentation analysis. Known as the ruler for rock size assessment, WipWare provides innovative tools that quantify particle size distributions (PSD) from pre-blast through post-blast and into mineral processing stages, creating a continuous feedback loop for process optimization.
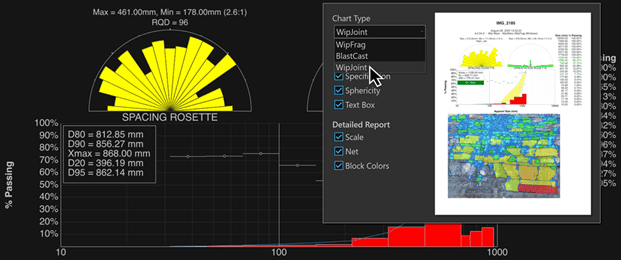
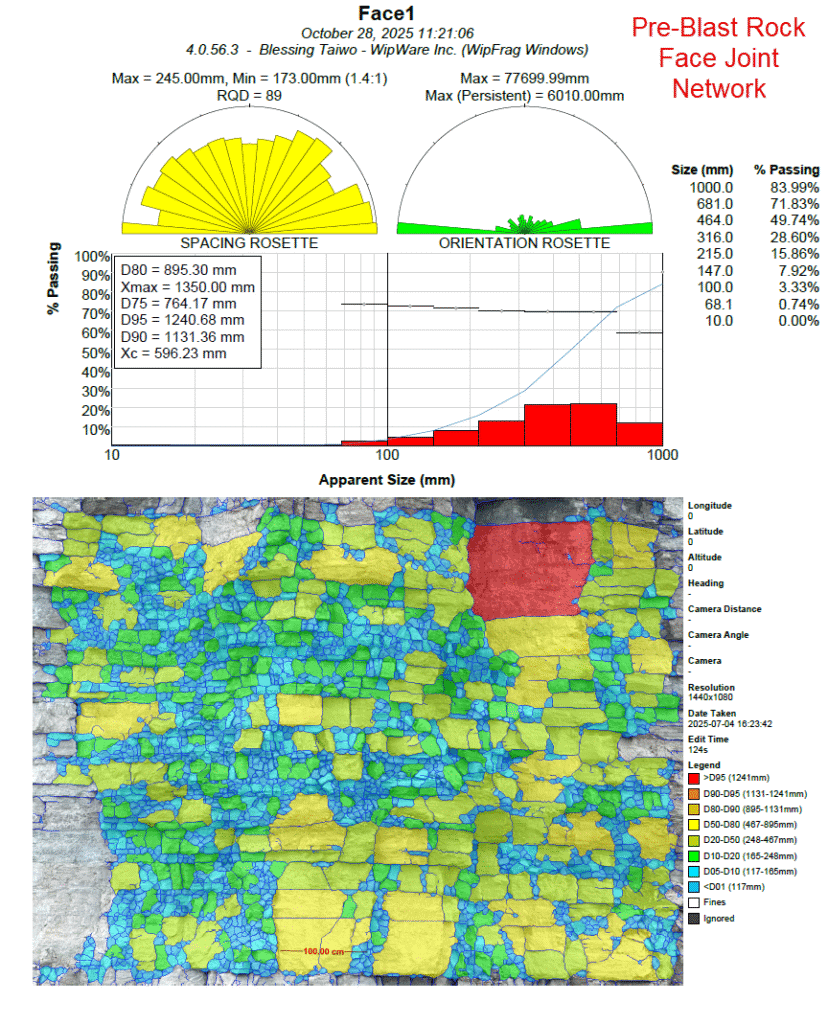
Pre-Blast Assessment with WipJoint
Understanding the geological conditions before blasting is crucial for predicting fragmentation outcomes. To bridge the gap between rock mass discontinuity and fragmentation potential, WipWare re-introduced WipJoint, a technology developed in 1990 by Dr. Norbert Maerz, Dr. John Franklin, and Dr. Tom Palangio.
WipJoint enables users to assess rock joint apparent spacing, apparent orientation, RQD and apparent in-situ block size from digital images of rock faces. This pre-blast information is invaluable for correlating structural conditions with post-blast fragmentation results. By analyzing joint characteristics, mining engineers can refine their blast design to ensure optimal energy distribution within the rock mass, thereby improving fragmentation and reducing energy waste in subsequent comminution stages.
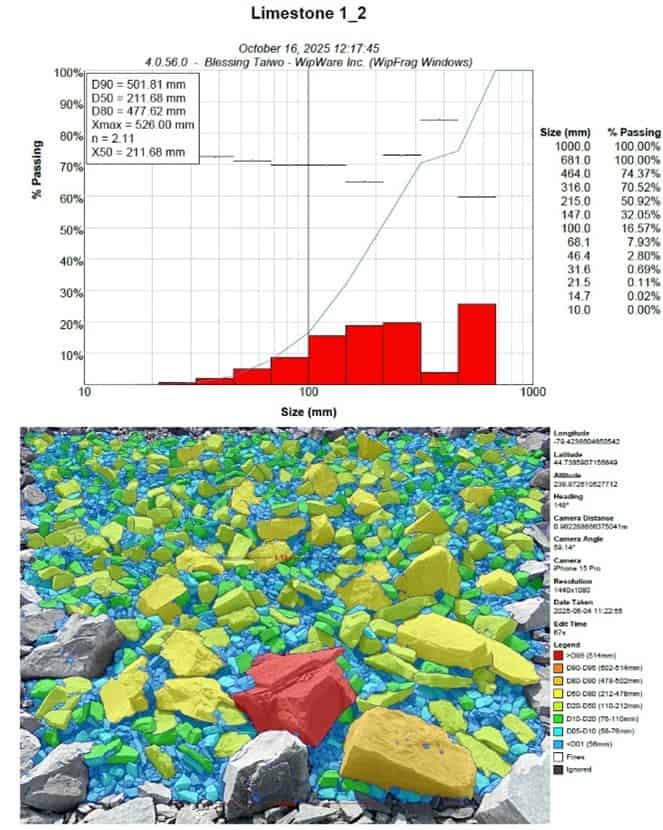
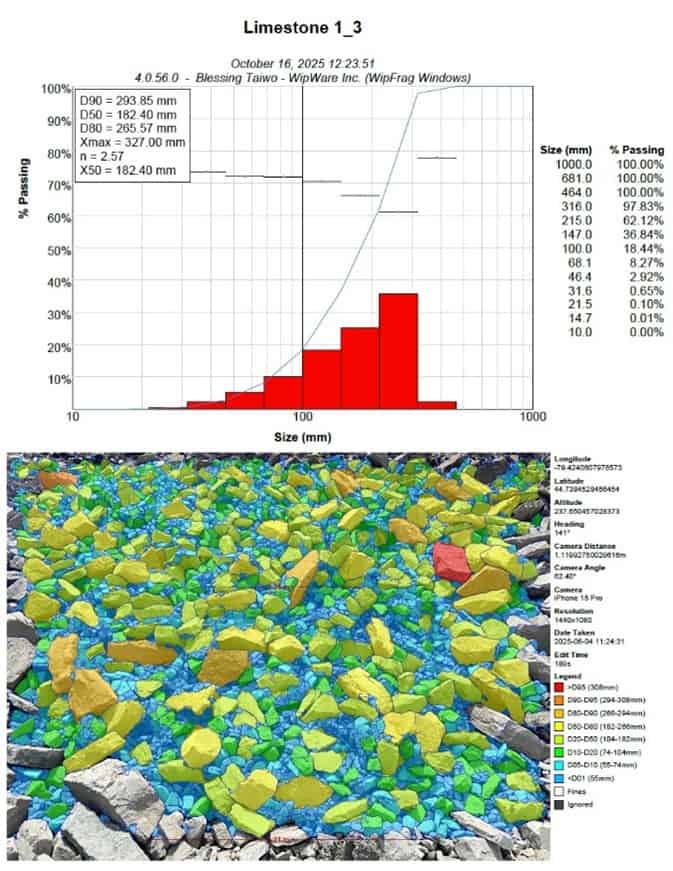
Post-Blast Fragmentation Analysis with WipFrag
Once blasting is completed, WipFrag provides the most reliable and efficient means for evaluating fragmentation results. Using advanced image analysis, WipFrag calculates the particle size distribution (PSD) of fragmented rock piles and compares the results to target sizes such as the primary crusher’s gape.
This capability allows for quantitative comparison between different blast designs, helping to identify which parameters yield the best fragmentation for energy efficiency and crusher compatibility. With tools like specification envelopes and boulder detection, WipFrag makes it possible to assess whether the blast produced the desired material size and shape for downstream processes.
Material Assessment During Haulage with Reflex 6
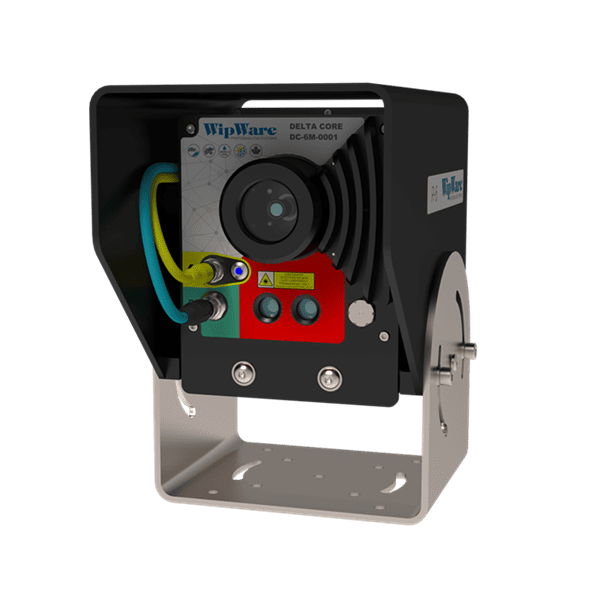
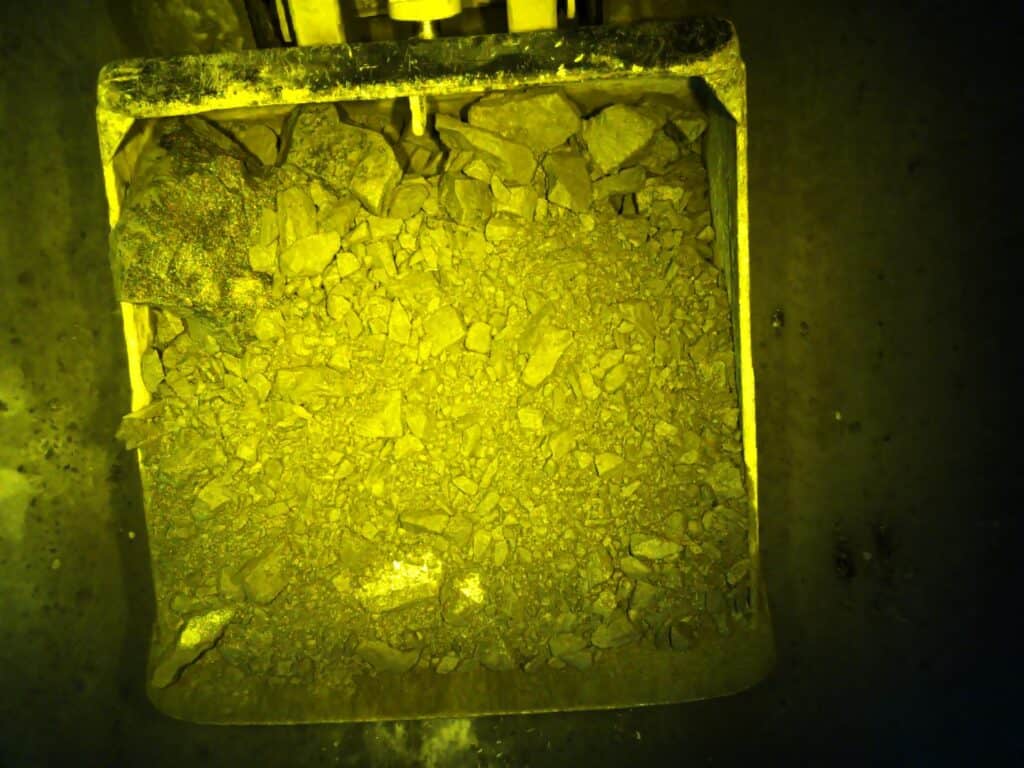
Fragmentation control doesn’t stop at the muck pile. During haulage, WipWare’s Reflex extends analysis to every truckload of material. Equipped with high-resolution cameras and an onboard computer, Reflex captures real-time images of material in transit, either while loaded on the truck or when being dumped at the crusher hopper or stockpile.
This technology enables continuous monitoring of material quality from each blast bench, providing operators with valuable data on fragmentation size, shape, uniformity and ore type variation. The Reflex system thus acts as vehicle load assessment platform, ensuring that no load goes unanalyzed.
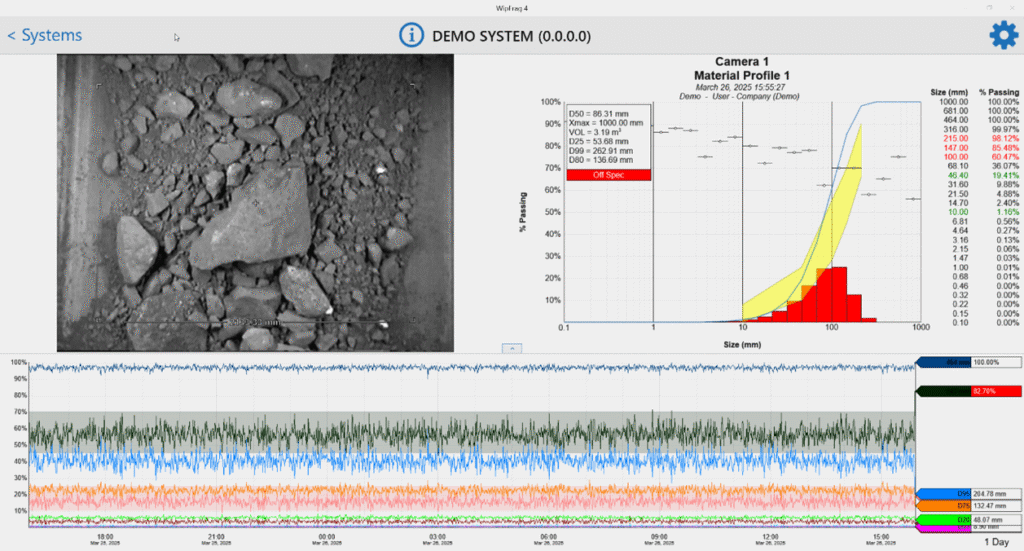
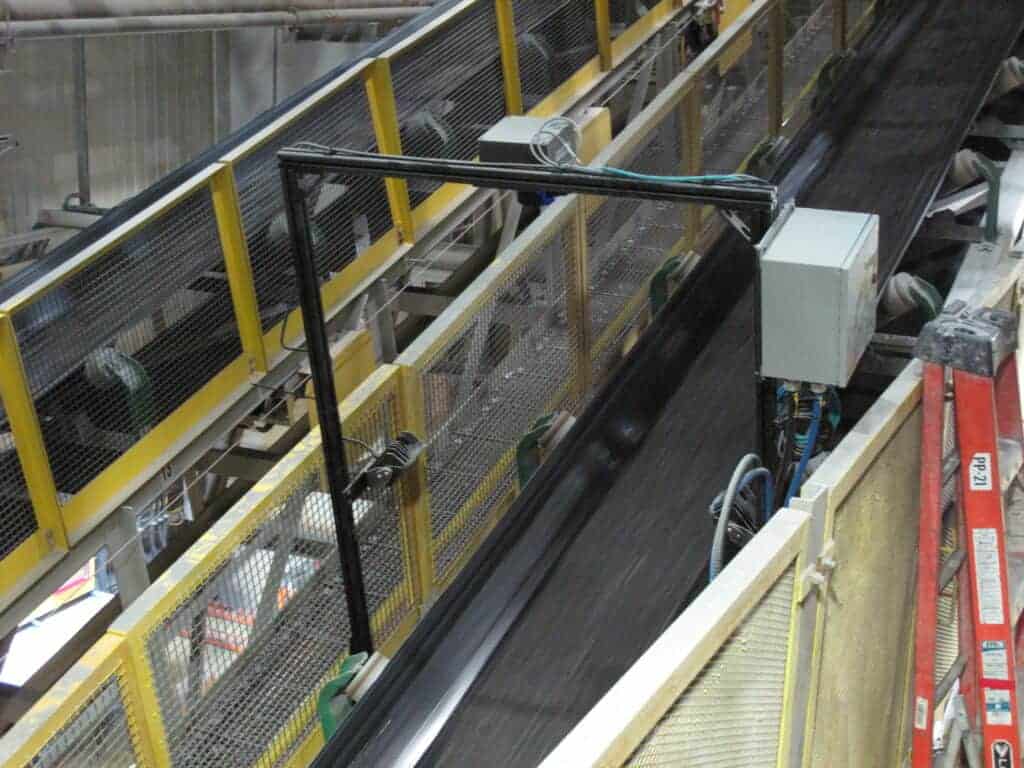
Conveyor Belt Monitoring and Process Optimization with Solo 6
At the mineral processing stage, WipWare Solo revolutionizes comminution monitoring. Installed over conveyor belts, Solo continuously analyzes the size distribution of material feeding the crusher or exiting as product. This intelligent system provides live feedback to operators, empowering them to make real-time decisions for process optimization.
Solo integrates seamlessly with existing process control systems such as Modbus TCP and OPC UA, allowing direct communication with plant control networks. This enables automatic crusher gap adjustment, SAG mill feed control, and load balancing, ensuring that the plant operates within optimal limits.
By maintaining consistent feed size and adjusting operational parameters accordingly, Solo helps minimize bearing pressure, reduce liner wear, improve throughput, and enhance overall energy efficiency throughout the comminution circuit.
WipWare technology provides a fully integrated suite of solutions that cover every stage of the comminution chain, from pre-blast geological assessment (WipJoint), through post-blast fragmentation evaluation (WipFrag), haulage assessment (Reflex), and processing control (Solo). By quantifying and connecting each step, WipWare enables mines to measure, monitor, and optimize energy use across the entire operation. The result is smarter blasting, improved crusher efficiency, and a more sustainable approach to mineral processing, achieving the ultimate goal of energy-efficient comminution.
Mine-to-Crusher Application of WipWare Solutions: Case Study at dstgroup Quarry
This study presents the third phase of a three-part research series focused on optimizing the interface between blasting and primary crushing operations at dstgroup aggregate quarry in Portugal, using WipWare solutions. The central goal is to improve fragmentation outcomes to better align particle size distribution (PSD) with crusher requirements, thereby reducing energy consumption and enhancing operational efficiency.
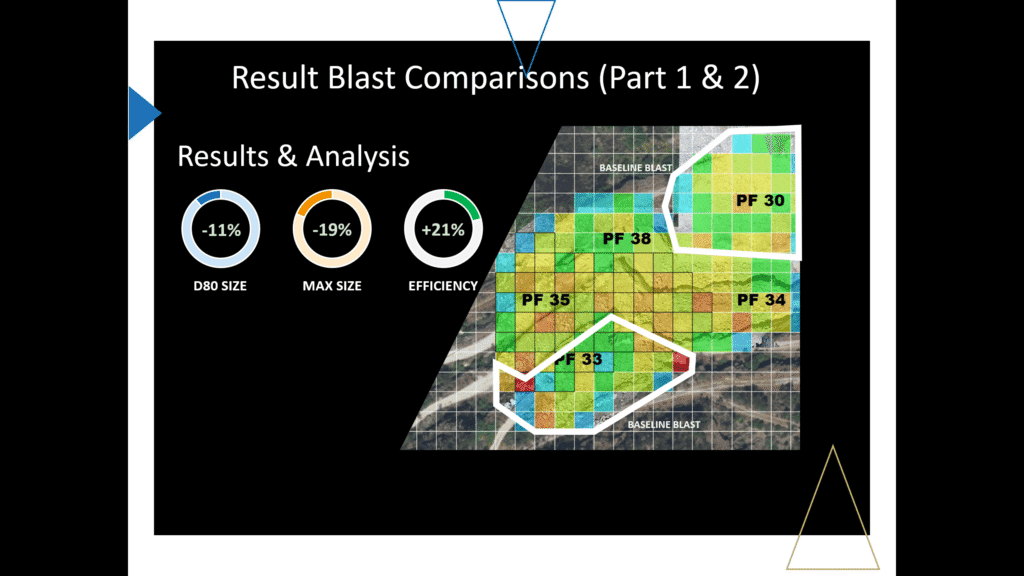
Building on the baseline methodology developed in Part 1, which incorporated 3D bench modeling and borehole surveys to assess blast compatibility with crusher specifications, the study identified discrepancies between predicted and actual fragmentation results. Part 2 applied targeted adjustments, such as reducing subdrill depth and altering stemming material, achieving measurable improvements in D80, maximum fragment size, and overall blast efficiency. However, boulder formation persisted in certain blast rows, prompting further optimization.
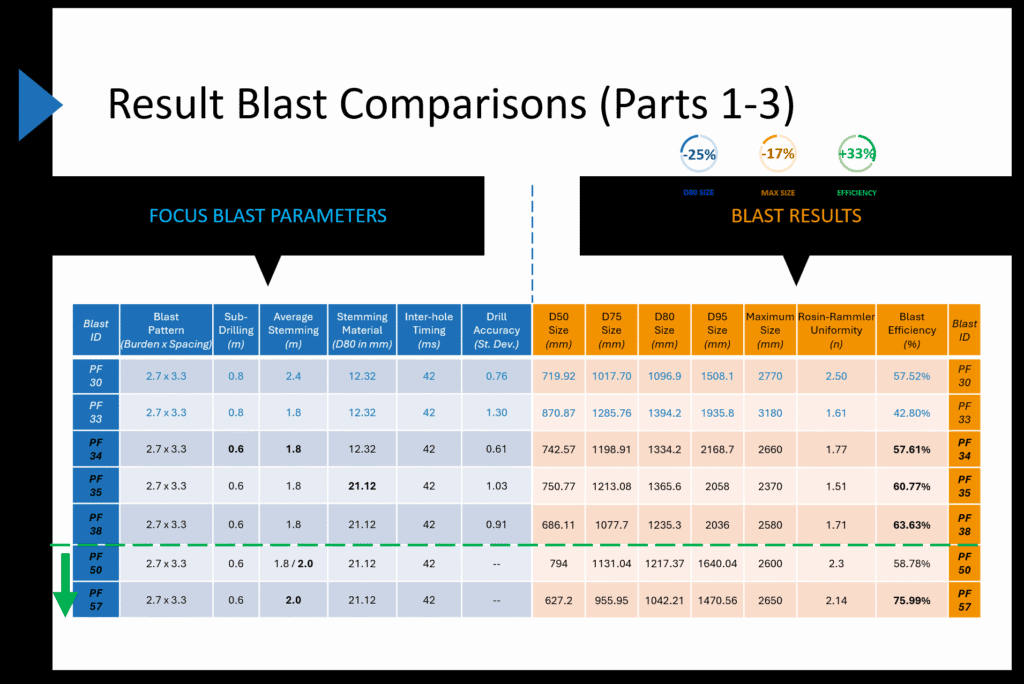
In this phase, the team implemented remaining recommendations, including refined drill and blast patterns, increased stemming size (from D80 12 mm to 21 mm) and length (from 1.8 m to 2 m), improved drilling accuracy, and adjusted inter-hole timing. High-resolution drone imagery and point-by-point blast surveys were integrated into O-PitSurface simulations to evaluate blast performance. WipFrag software was utilized for detailed particle size analysis, enabling comparison of fragmentation outcomes before and after design modifications.
Results demonstrated significant gains: D50 decreased by 19%, D80 and D95 by 20% and 23%, respectively, and maximum particle size reduced by 3%, indicating better control over oversized material. Fragmentation efficiency improved by over 21%, and the uniformity index increased by 16%, reflecting more consistent and predictable PSD. Adjustments to stemming material and length enhanced energy confinement, minimizing premature blowout and promoting even energy distribution throughout the blast column.
Run-of-mine monitoring with the Reflex system above the primary crusher provided real-time PSD analysis, confirming continuous improvement in fragmentation and crusher feed consistency. Over a six-month period, key size distribution metrics consistently trended downward, validating the effectiveness of iterative blast parameter adjustments and demonstrating the value of data-driven, integrated mine-to-crusher strategies.
In conclusion, the study illustrates how WipWare solutions, including WipFrag, Reflex, and O-PitSurface, enable quarry operations to optimize fragmentation, reduce oversize and fines, improve crusher compatibility, and enhance overall operational efficiency. The mine-to-crusher framework serves as a replicable model for energy-efficient, predictable, and high-performance blast-to-crusher integration.
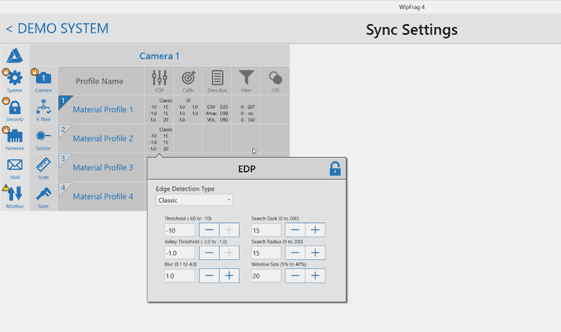
Welche Kantenerkennungsparameter (EDP) sollte ich verwenden?
Bei der Verwendung von WipFrag zum Analysieren von Misthaufen können Sie die folgenden Richtlinien verwenden:
Geldstrafen = Schieberegler nach rechts
Mittel = Schieberegler in der Mitte
Groß = Schieberegler nach links
Generally, you want to have accurate nets on the small- to medium-sized particles. Once you find a suitable net for this size of material you can manually edit the larger material. Using this method will help provide more accurate results.
It’s also recommended that you try to keep a similar EDP for images of the same muck pile, or when trying to compare different muck piles.
If finer adjustments are required, you can activate the ‘Show Advanced Controls’ checkbox to access numeric inputs featuring a wider range of finer adjustments than the basic sliders provide.
WipWare Automated Photoanalysis Systems and EDP
In Delta, einer erweiterten Version der WipFrag-Software, die auf automatisierten Photoanalysesystemen von WipWare läuft, verwenden wir einen Prozess namens Best Fit EDP. Bei Online-Systemen wird dieser Vorgang in der Regel zum Zeitpunkt der Installation vor Ort durchgeführt. Es wird implementiert, indem ein Bild von typischem Material aufgenommen wird, nachdem alle Hardware- und Softwareeinstellungen abgeschlossen sind. Wir verfolgen so viele Partikel wie möglich manuell und führen dann die Best Fit EDP-Funktion aus. Die Software versucht dann, die manuelle Spur der Partikel mit den verfügbaren EDV-Einstellungen abzugleichen. Best Fit EDP gibt einen Satz numerischer Werte aus, die in die erweiterten EDP-Steuerelemente eingegeben werden. Diese Methode ist sehr genau und liefert unseren Online-Systemen gut geeignete Kantenerkennungsparameter. Es kommt selten vor, dass die EDV eines Online-Systems geändert werden muss, aber wenn dies der Fall ist, kann dies aus der Ferne von unserer Zentrale aus erfolgen.
Best Fit EDP was recently added to WipFrag software. Because of the time involved in editing an image to produce a good Best Fit EDP, this feature is most practical to reduce the amount of manual editing required if you are going to be analyzing many images (20, 30 or more) of the same material under the same conditions. For most users, where smaller batches tend to be analyzed at once, using the sliders to adjust the EDP is faster.
Within WipFrag, there is also a feature called Auto EDP which attempts to determine the edge detection parameters automatically. This feature works well if the particle size range is narrow.
Wir verwenden Cookies auf unserer Website, um Ihnen die relevanteste Erfahrung zu bieten, indem wir uns an Ihre Präferenzen erinnern und Besuche wiederholen. Indem Sie auf „Akzeptieren“ klicken, stimmen Sie der Verwendung ALLER Cookies zu.
Diese Website verwendet Cookies, um Ihre Erfahrung zu verbessern, während Sie durch die Website navigieren. Von diesen werden die Cookies, die nach Bedarf kategorisiert werden, in Ihrem Browser gespeichert, da sie für das Funktionieren der grundlegenden Funktionen der Website wesentlich sind. Wir verwenden auch Cookies von Drittanbietern, mit denen wir analysieren und verstehen können, wie Sie diese Website nutzen. Diese Cookies werden nur mit Ihrer Zustimmung in Ihrem Browser gespeichert. Sie haben auch die Möglichkeit, diese Cookies zu deaktivieren. Das Deaktivieren einiger dieser Cookies kann sich jedoch auf Ihre Browser-Erfahrung auswirken.
Notwendige Cookies sind unbedingt erforderlich, damit die Website ordnungsgemäß funktioniert. Diese Cookies gewährleisten anonym grundlegende Funktionen und Sicherheitsmerkmale der Website.
Plätzchen
Dauer
Beschreibung
cookielawinfo-checbox-analyse
11 Monate
Dieses Cookie wird vom GDPR Cookie Consent Plugin gesetzt. Das Cookie wird verwendet, um die Benutzereinwilligung für die Cookies in der Kategorie "Analytics" zu speichern.
cookielawinfo-checbox-funktional
11 Monate
Das Cookie wird durch GDPR-Cookie-Einwilligung gesetzt, um die Benutzereinwilligung für die Cookies in der Kategorie "Funktional" aufzuzeichnen.
cookielawinfo-checbox-andere
11 Monate
Dieses Cookie wird vom GDPR Cookie Consent Plugin gesetzt. Das Cookie wird verwendet, um die Benutzereinwilligung für die Cookies in der Kategorie "Sonstige" zu speichern.
cookielawinfo-checkbox-notwendig
11 Monate
Dieses Cookie wird vom GDPR Cookie Consent Plugin gesetzt. Die Cookies werden verwendet, um die Einwilligung des Benutzers für die Cookies in der Kategorie "Notwendig" zu speichern.
cookielawinfo-checkbox-leistung
11 Monate
Dieses Cookie wird vom GDPR Cookie Consent Plugin gesetzt. Das Cookie wird verwendet, um die Benutzereinwilligung für die Cookies in der Kategorie "Leistung" zu speichern.
betrachtete_cookie_policy
11 Monate
Das Cookie wird vom GDPR Cookie Consent Plugin gesetzt und wird verwendet, um zu speichern, ob der Benutzer der Verwendung von Cookies zugestimmt hat oder nicht. Es werden keine personenbezogenen Daten gespeichert.
Funktionale Cookies helfen dabei, bestimmte Funktionen auszuführen, z. B. den Inhalt der Website auf Social Media-Plattformen zu teilen, Feedbacks zu sammeln und andere Funktionen von Drittanbietern.
Leistungscookies werden verwendet, um die wichtigsten Leistungsindizes der Website zu verstehen und zu analysieren, um den Besuchern eine bessere Benutzererfahrung zu bieten.
Analytische Cookies werden verwendet, um zu verstehen, wie Besucher mit der Website interagieren. Diese Cookies helfen bei der Bereitstellung von Informationen zu Metriken wie Besucherzahl, Absprungrate, Verkehrsquelle usw.
Werbe-Cookies werden verwendet, um Besuchern relevante Anzeigen und Marketingkampagnen bereitzustellen. Diese Cookies verfolgen Besucher auf verschiedenen Websites und sammeln Informationen, um angepasste Anzeigen bereitzustellen.