Excessive burden in blasting refers to having too much rock mass in front of the blast holes. This is relative to the designed blast parameters. The burden is the distance between a blast hole and the free face.
If this distance is too large, it can significantly impact the efficiency and effectiveness of the blasting operation. Here are some effects and consequences of excessive burden:
1. Incomplete Fragmentation:
When the blast design has too much burden distance between rows, the explosive energy may not be sufficient to break the rock effectively, leading to large, unbroken boulders or slabs.
2. Higher Vibration and Noise:
Relating ground vibration to this phenomenon, excessive burden can cause more energy to be transferred to the ground as vibrations, potentially causing damage to nearby structures and creating safety hazards (Blair & Armstrong, 2001).
On the other hand, inadequate burden can result in higher levels of air overpressure and noise, affecting the environment and nearby communities.
It’s worth noting that when there is excessive burden in blast design, the energy from the explosives is not used efficiently, leading to wasted explosive material and higher operational costs.
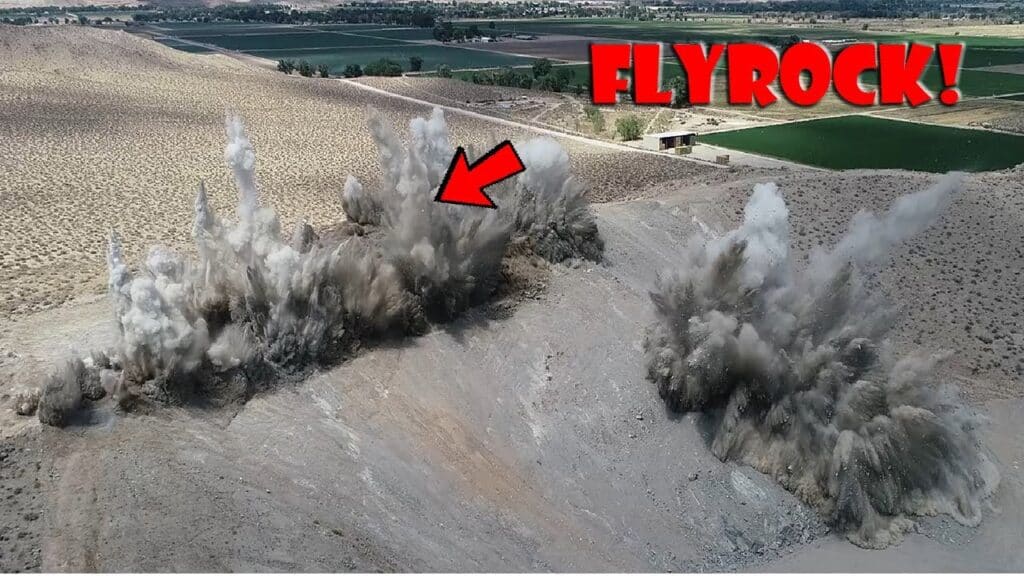
3. Flyrock Hazards:
Excessive burden can cause unpredictable flyrock, posing significant safety risks to workers and equipment.
4. Inefficient Loading and Hauling:
The resulting muckpile from an overburdened blast may have uneven fragmentation. This makes it harder to load and transport the material efficiently.
5. Incomplete Detonation and Misfires:
Excessive burden can cause incomplete detonation of explosives. This leads to misfires and the need for re-blasting, which adds to safety risks and costs.
Conclusion
In their paper for the 2nd World Conference on Explosives and Blasting Technique in 2003, Onederra and Esen stated that there is usually a discrete element of time that has elapsed from the time of explosive detonation to mass burden displacement. This time is designated as the minimum response time (Tmin) and is dependent on the burden mass, explosive and dynamic material response to the explosive stimulus. Generally, but not always, Tmin can be decreased by employing small burdens, using higher energetic explosives or a combination of both.
References
Blair, D. P., & Armstrong, L. W. (2001). The influence of burden on blast vibration. Fragblast, 5(1-2), 108-129.
Onederra, I., & Esen, S. (2003). Selection of inter-hole and inter-row timing for surface blasting—an approach based on burden relief analysis. In Proceedings of the 2nd world conference on explosives and blasting technique, Prague. Taylor & Francis (pp. 269-275).
Download WipFrag at https://wipware.com/get-wipfrag/. Assess your blasting results, spot regions with poor fragmentation and trace back to your drill and blast design.
A Quick Summary on WipFrag version 4 and its New Features
Overview
Mining is the extraction of valuable materials called ore or sometimes industrial minerals from the earth crust, using appropriate technology with the aim to provide raw materials for industrial use.
The materials exist in massive form and must therefore be broken into handable size through blasting operation or other safe and productive ways. The use of explosive to break rock into smaller sizes had been adopted several years due to it well know advantages.
Image analysis had been proven as the way forward to enhancing blasting and improving downstream operation efficiency through accurate visualization. Image analysis is a technique use to evaluate blasting output and to monitor material flow during mineral processing.
WipFrag Image Analysis software is a powerful tool for analyzing particle size distribution (PSD) in digital images collected from various blast muck-pile, including fresh phase muckpiles after blasts, time series stockpile samples, and even drone or UAV images.
Features and Advantages
Let’s delve into its features and advantages: 1. Instant PSD Analysis: WipFrag 4 provides instant PSD analysis of the captured images. Whether you’re assessing post-blast muckpiles or analyzing stockpile samples, this software delivers accurate fragmentation data.
2. Auto-Scaling Capabilities: With auto-scaling capabilities, WipFrag 4 ensures precise measurements. It’s a cost-effective solution that saves time and resources.
3. Cross-Platform Compatibility: Seamlessly analyze images across multiple platforms, including iOS, Android, and Windows. Share results effortlessly and optimize blast performance.
4. BlastCast Blast Forecast Module: This module, included in the software, helps predict fragmentation when used alongside WipFrag particle size data. It’s a valuable tool for blast planning.
5. Deep Learning Edge Detection: This amazing tool will increase accuracy from our previous Simple edge detection and almost eliminate the need to manually edit your images.
6. Integration with WipWare Photoanalysis Systems: WipFrag 4 also controls sixth-generation WipWare Photoanalysis Systems. Monitor conveyor belts or heavy-duty vehicles in real time, providing continuous particle size data to your portable device 24/7.
WipFrag Software Options Available
WipFrag 4 offers flexible licensing options to suit different operational needs, whether you require continuous blast fragmentation analysis or occasional assessments. Here’s a quick overview of what’s available:
1. Annual Subscription
Ideal for operations requiring consistent fragmentation analysis, the annual subscription allows up to 10 simultaneous device activations per license. This is a cost-effective solution for teams working across multiple sites or needing frequent analysis.
2. Pay-Per-Use (PPU) Option
For users who need WipFrag on a project basis or for occasional assessments, the PPU image credit is a great option. This model offers flexibility, enabling you to pay only when you use the software without committing to an annual plan.
3. UAV/Orthomosaic Image Analysis:
This is included in the annual subscription with unlimited analyses for the year. If credits are preferred, a minimum of 3 credits is required to unlock the analysis results. Number of credits is determine by hectare.
4. MailFrag Single or UAV/Orthomosaic Image Analysis:
MailFrag is our online service when customers need a third party to analyze their images. Single image analysis is 3 credits and UAV/Orthomosaic image analysis is a minimum of 9 credits based on hectare. MailFrag is only available for use with credits. It is not included as an option with the annual subscription.
Which License is Right for You?
If you’re unsure which license best fits your needs, contact us to discuss your application and explore the best solution for your operation. Whether you need continuous monitoring or occasional analysis, WipFrag has an option that works for you!
Remember that credits can be transferred to other WipWare Account users. Additionally, UAV/orthomosaic images must be analyzed with the Windows version and be in GeoTIFF format. In summary, WipFrag 4 offers a cost-effective and accurate solution for fragmentation analysis, making it an essential tool for professionals in various industries.
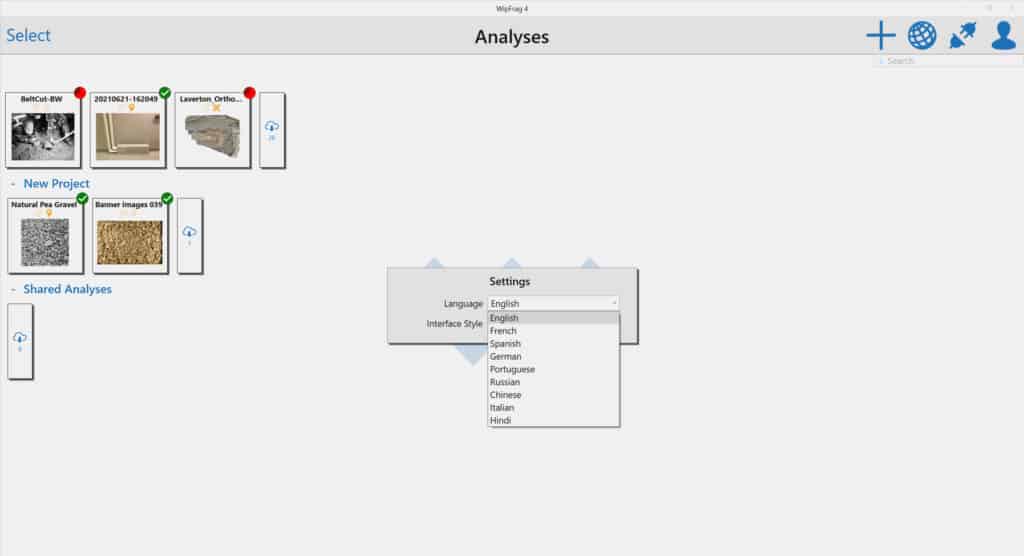
Multiple Language Options
WipFrag 4 has multiple language options available for our customers. The following nine languages are now available:
Inglese, francese, spagnolo, tedesco, portoghese, russo, cinese, italiano e hindi.
Per modificare la preferenza della lingua in WipFrag 4, segui questi passaggi:
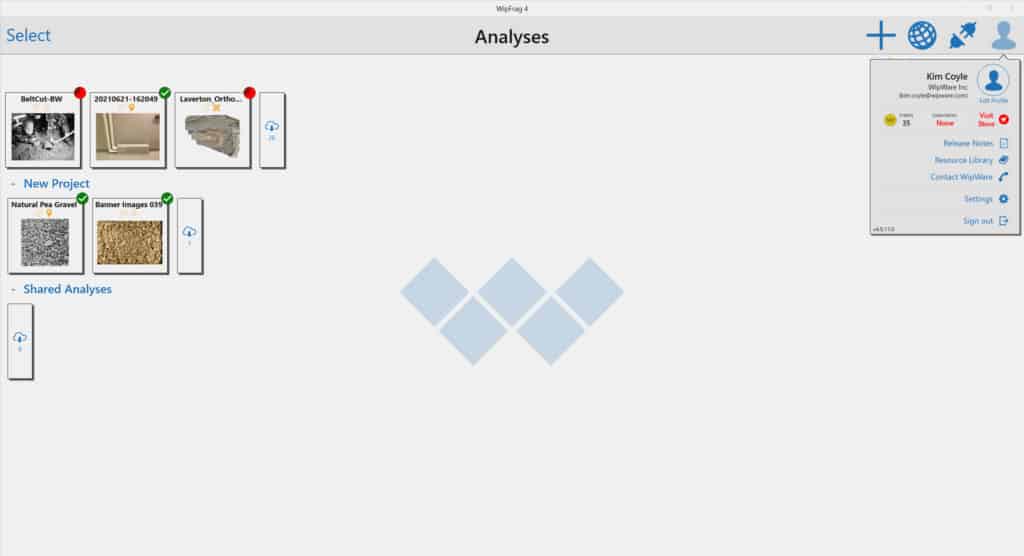
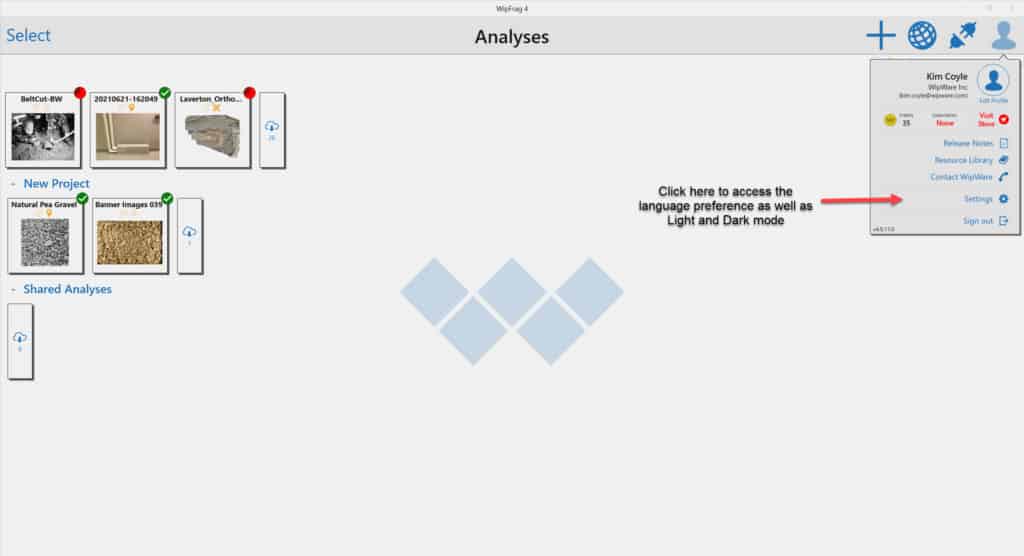
Click on your Profile Icon
Fare clic sul pulsante Impostazioni
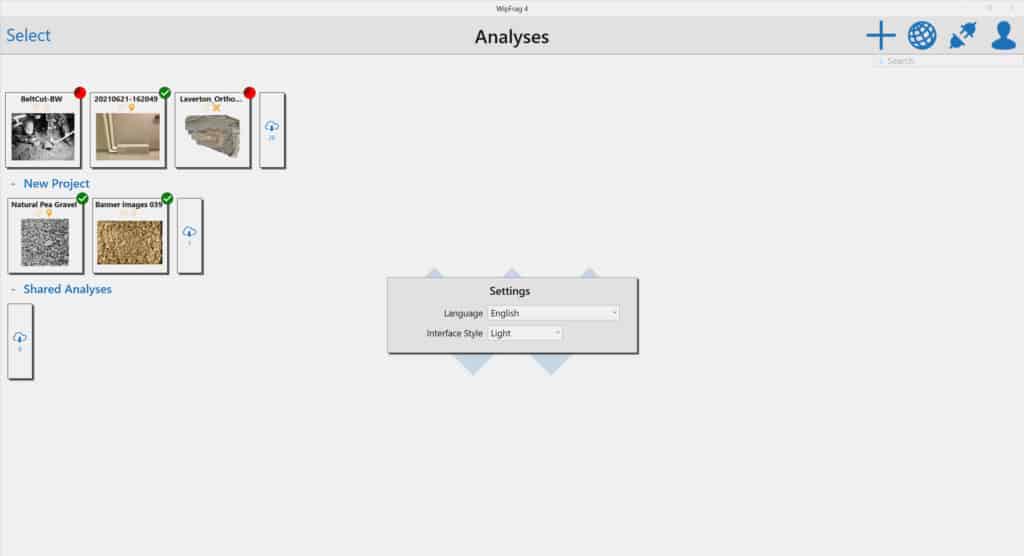
In Settings, click on Language to access the drop-down menu
Nel menu a discesa sono disponibili 9 opzioni di lingua
Per ulteriori informazioni sul nostro software di analisi delle immagini WipFrag 4, visitare il nostro Pagina WipFrag.
Installazioni
Literature Review: Application of WipWare Technology
WipWare’s fragmentation analysis technologies have been widely applied across various mining operations to solve critical challenges. These were associated with material flow, fragmentation consistency, energy use, and overall process efficiency. I came across Tom Palangio‘s works on numerous case studies highlighting the effectiveness of WipWare‘s tools. These tools optimized blasting practices and downstream processing. This review presents a summary of several influential studies and industrial applications of WipWare technology.
Photographic Fragmentation Analysis
Selbaie Mine, Joutel, Quebec, Canada
In the mid-1990s, Selbaie Mine utilized photographic fragmentation analysis using WipFragto assess explosive performance and optimize blasting patterns. The integration of WipWare technology enabled the mine to monitor and control several key performance indicators. Some of these indicators included energy consumption for crushing, loading rates, haul truck payloads, secondary blasting costs, and maintenance expenditures. Fragmentation data revealed a more comprehensive understanding of the effects of blast results on overall mining cost structures. This information allowed the mine to better manage ore processing operations. They could quantify the true cost of mineral handling based on fragment size.
Significant Pattern Optimization
INCO Coleman Mine, Sudbury, Ontario, Canada
INCO’s Coleman Mine used WipFrag during a detailed study in 1994, resulting in significant pattern improvement. The original tight blast pattern (5ft x 10ft) yielded a characteristic size (Xc) of 0.617 m, with substantial oversize material requiring re-blasting. Progressive expansion of the blast pattern to 6ft x 10ft and eventually 7ft x 10ft not only improved fragmentation (Xc = 0.318 m) but also reduced oversize entirely. WipFrag data was instrumental in determining optimal fragmentation, with INCO realizing up to 40% blast pattern expansion and 80% cost savings. Additionally, the technology allowed for reductions in fines generation, further streamlining ore handling and improving crusher feed quality.
Correlate Ore Fragmentation and Hardness with Mill Performance
Highland Valley Copper, Logan Lake, British Columbia, Canada
At Highland Valley Copper (HVC), the team used WipWare tools to correlate ore fragmentation and hardness with mill performance. WipWare’s WipFrag software, Reflex vehicle analysis system and Solo conveyor analysis system played a central role in tracking ore size distributions from the pit through to the mill feed. This enabled real-time optimization of crusher and mill settings. The mine’s dispatch system integrated fragmentation data to guide stockpile management and minimize feed segregation. WipFrag analysis revealed that feed consistency across the grinding lines could be improved by adjusting feeder ratios. This capability to quantify fragmentation effects allowed HVC to perform cost benefit analyses and optimize the balance between blast quality and mill throughput.
Detonator Timing Accuracy and Improved Fragmentation using WipFrag
Bartley and Trousselle – Ogdensburg, New York, USA
At Benchmark Materials Quarry, Bartley and Trousselle demonstrated the link between detonator timing accuracy and improved fragmentation using WipFrag. Digital programmable detonators yielded superior blast uniformity and reduced vibration levels. WipWare’s image analysis facilitated the evaluation of blast performance improvements by providing accurate fragmentation size distribution data.
The Effects of Improved Fragmentation on Mechanical Performance and Power Usage in the Crushing Circuit
Lafarge Canada Inc. – Exshaw, Alberta, Canada
Lafarge’s Exshaw operations applied WipFrag to examine the effects of improved fragmentation on mechanical performance and power usage in the crushing circuit. A redesigned blast using 102 mm holes led to more uniform fragmentation. This resulted in a 16% increase in crusher throughput and a 30% reduction in power consumption. WipWare data also informed decisions related to equipment selection (e.g., drill bits) and wall control, leading to improved safety and reduced vibration impacts on neighboring communities.
Cost-Effective and Reliable Fragmentation Assessment Tool
Barkley and Carter – Evaluation of Optical Sizing Methods
Barkley and Carter evaluated WipFrag as both a cost-effective and reliable fragmentation assessment tool. Their work highlighted that previous blast optimization efforts were constrained by the lack of efficient sizing techniques. In contrast, WipFrag enables meaningful decision-making in blast modeling, mining method selection, and economic planning. The study underscored the significance of image-based sampling frequency, particularly in varied muck pile conditions, to derive actionable insights on crusher performance and feed consistency.
Assess Fragmentation and Stemming Uniformity
Chiappetta, Treleaven, and Smith – Panama Canal Expansion
During the expansion of the Panama Canal, WipFrag was employed to assess fragmentation and stemming uniformity in complex geological and logistical conditions. The integration of WipWare into blasting operations enabled engineers to both track blast outcomes and support adaptive design decisions in real time. In a project characterized by not only marine traffic but also saturated zones and tight deadlines, the technology provided essential support in achieving controlled fragmentation and predictable material handling.
Conclusion
These reviewed case studies emphasize WipWare’s critical role in improving the efficiency and economics of mining operations. Through accurate and real time fragmentation analysis, WipWare technologies facilitate optimization across the mine to mill value chain. From reducing energy consumption and equipment wear, to improving blast designs and minimizing fines, WipWare’s technologies offer robust solutions to a range of material flow problems in both surface and underground mining environments. These outcomes underscore the value of fragmentation analysis in modern mining practice, unquestionably supporting data-driven decision making and continuous process improvement.
Efficient drilling and blasting design is fundamental to achieving optimal rock fragmentation, cost control, and downstream productivity. The first step in designing an effective blast is selecting appropriate geometrical parameters based on rock properties, explosive characteristics, and site-specific conditions. This article introduces initial design ratios that can be used as first approximations in blast planning, keeping in mind that adjustments are necessary as field data is collected.
1. Burden Estimation
The burden is distance between a blasthole and the free face is influenced by rock density and explosive diameter. Initial guidelines suggest: Light rock (2.2 g/cc): 28 × explosive diameter Medium rock (2.7 g/cc): 25 × explosive diameter Dense rock (3.2 g/cc): 23 × explosive diameter These values can be refined based on fragmentation feedback and in-situ rock behavior.
2. Spacing Between Holes
Spacing ensures uniform energy distribution and reduces overlap or gaps between blast effects: Instantaneous firing by row: 1.8 – 2.0 × burden Large-diameter holes (sequential): 1.2 – 1.5 × burden Small-diameter holes (sequential): 1.15 – 1.8 × burden
3. Bench Height
Bench height depends on operational scale and burden: Typical range: 1.5 – 4.0 × burden, or higher in some cases.
4. Sub-Drilling
Sub-Drilling ensures complete breakage at the toe, especially important in stratified or dense formations: Flat bedding at toe: 0.0 – 0.1 × burden Easy toe: 0.1 – 0.2 × burden Medium toe: 0.2 – 0.4 × burden Difficult toe (vertical bedding): 0.5 × burden General view: (3 to 15) x D
5. Stemming Column Length
Stemming retains explosive energy in the hole and controls flyrock: General range: 0.5 – 1.3 × burden Increase multiplier for wet holes or if drill cuttings are used Decrease multiplier for dry holes or if angular chips are used For extremely cautious blasting (no throw or flyrock): Use up to 36 × hole diameter for stemming Deck delay stemming lengths: Dry holes: 6 × hole diameter Wet holes: 12 × hole diameter Stemming material size = D/10 to D/20
6. Burden Stiffness Ratio (Sr)
=H/B : 2 to 3.5 good fragmentation Sr> 3.5 very good fragmentation Control Blast design Presplit blasting Spacing = Hole diameter x 12 Burden = 0.5 x production blast burden (B) Uncharged length at top = 10 x D Powder factor = 0.5kg per square metre of face Smooth Blasting Spacing = 15 x Hole diameter (hard rock) 20 x Hole diameter (soft rock) Burden = 1.25 x Spacing Rock type PF (kg/m3) Hard 0.7 – 0.8 Medium 0.4 – 0.5 Soft 0.25 – 0.35 Very Soft 0.15 – 0.2
Conclusion
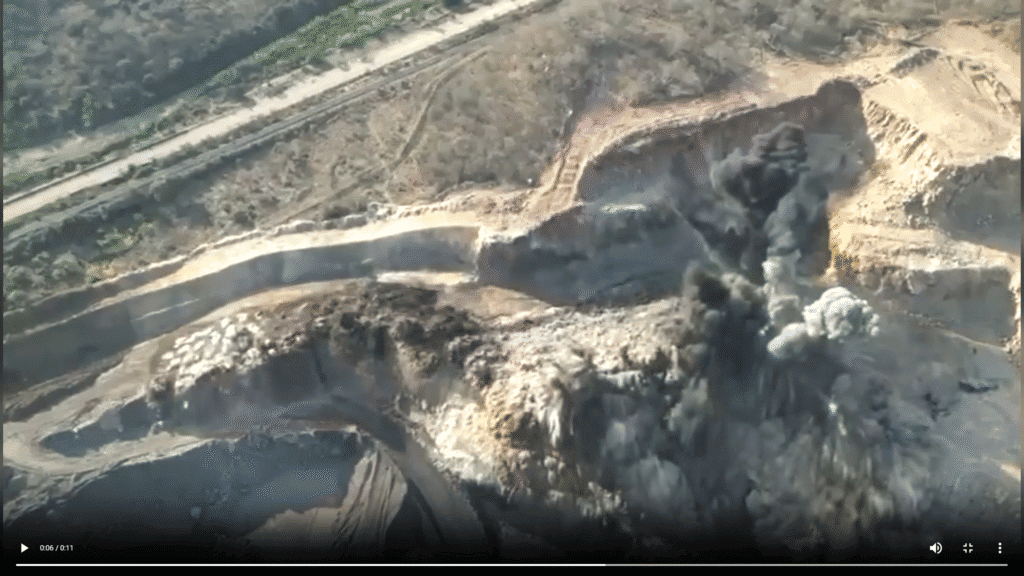
These ratios serve as a starting framework in blast design. Each site’s geological characteristics and performance feedback should guide further optimization. In Part 2, we will explore charge distribution, and initiation to refine blast performance further. Bibliography Dyno Nobel Blasting and Explosives Quick Reference Guide 2010 Video credit to Chris Addicott
Understanding the Interaction between Blast Controllable Parameters and Explosive Energy Distribution
Part 2
In surface and underground mining operations, achieving optimal fragmentation and downstream efficiency depends largely on how well explosive energy is distributed throughout the blast zone (Zhang et al., 2023). For drilling and blasting engineers, this distribution is not random, it is directly influenced by the status of controllable blast parameters.
1. Hole Diameter and Burden/Spacing
The size of the blasthole plays a central role in determining the energy per unit volume of rock (powder factor). Larger holes allow for higher explosive loading, but without proper adjustment of burden and spacing, energy may either vent prematurely or be insufficient to break the rock mass effectively. A well-balanced burden and spacing ensures that the explosive energy is confined and directed where it is most effective within the rock’s natural weaknesses.
2. Stemming Length and Type
Stemming acts as a confinement mechanism, and its length determines how much energy is retained to do useful work (fragmentation) versus lost to the atmosphere (airblast and flyrock). Too short a stemming column leads to excessive energy release upwards, reducing breakage efficiency. The stemming material also matters; inert and high-friction materials retain energy better than loose or damp fill.
3. Explosive Type and Density
Different explosives have varying detonation velocities and energy outputs. Choosing an explosive with suitable characteristics for the rock type and desired fragmentation outcome ensures that the energy is neither excessive (leading to fines and overbreak) nor insufficient (resulting in boulders and poor fragmentation). Additionally, the density of the explosive affects how much energy is loaded per unit of borehole length.
4. Initiation Sequence and Timing Delays
The sequence and timing of detonation determine how energy is transferred between holes and how the rock mass reacts dynamically. Proper delay timing ensures effective burden relief and sequential rock movement, promoting efficient energy transfer and reducing the risk of airblast and ground vibration.
Conclusion
Blast controllable parameters are not isolated design factors, they work in concert to shape how explosive energy is distributed and utilized.
Things to Know About WipFrag
WipFrag 4 is a powerful image analysis tool used to assess blast results by evaluating particle size distribution from blast muckpiles images. It helps determine fragmentation quality, boulder presence, and crusher compatibility. With tools like specification envelope, Edit Assist, and autoscale, WipFrag 4 supports continuous blast monitoring and optimization, enhancing productivity and reducing oversize-related costs. Click QUIto download and learn on the demo for free.
“Blast safely with proper PPE”
The Importance of Bottom Charge and Energy Distribution in Blasting
Part 3
In surface and underground mining operations, achieving optimal fragmentation through effective blast design is key to operational efficiency. One critical yet often underappreciated aspect of blast design is the bottom charge the portion of explosive placed at the bottom of the blast hole and how it contributes to energy distribution within the rock mass.
What is Bottom Charge?
The bottom charge, also known as the column base charge, is typically a higher-density explosive or a concentrated portion of the total charge placed at the toe of the hole. Its main function is to initiate breakage from the bottom up, ensuring that the entire burden is effectively fractured and displaced.
Why It Matters
1. Crushing and Fragmentation at the Toe
The toe region is the most resistant part of the burden. Without adequate energy at the bottom, poor fragmentation or even toe problems (hard toe) may result. A well-calculated bottom charge ensures that this area receives enough energy to initiate crack formation and propagation.
2. Improved Energy Distribution
Uniform energy distribution along the blast hole is vital. Concentrating more energy at the bottom allows better stress wave propagation, reduces energy loss into air gaps or stemming zones, and leads to more consistent fragmentation throughout the burden.
3. Reduction of Fly Rock and Overbreak
A well-designed bottom charge reduces uncontrolled energy release at the top of the hole, minimizing fly rock and overbreak. This promotes safer and cleaner operations, especially in populated or infrastructure-sensitive areas.
A Simple Step-by-Step Calculation for Bottom Charge Quantity
1. Determine the hole diameter Let’s assume: 2. Hole diameter d=102 mm=0.102 m 3. Cross-sectional area of the hole (A): A = (pi*d*d)/4 A= 0.00817m^2 4. Explosive density (ρ): Assuming ANFO ρ=850kg/m^3 5. Determine bottom charge length Let’s assume: Bottom charge length (Lb)=1.2 m 6. Calculate the bottom charge (mass) Bottom charge mass=A×Lb×ρ=0.00817×1.2×850≈8.33 kg What determine the bottom charge length? Rock hardness and strength, Hole diameter, decking strategy, Bench height, Desired fragmentation and toe breakage, Stemming length, Water presence in the hole, Desired throw or displacement, Blast pattern, geometry, etc. The role of the bottom charge goes beyond merely initiating the blast.
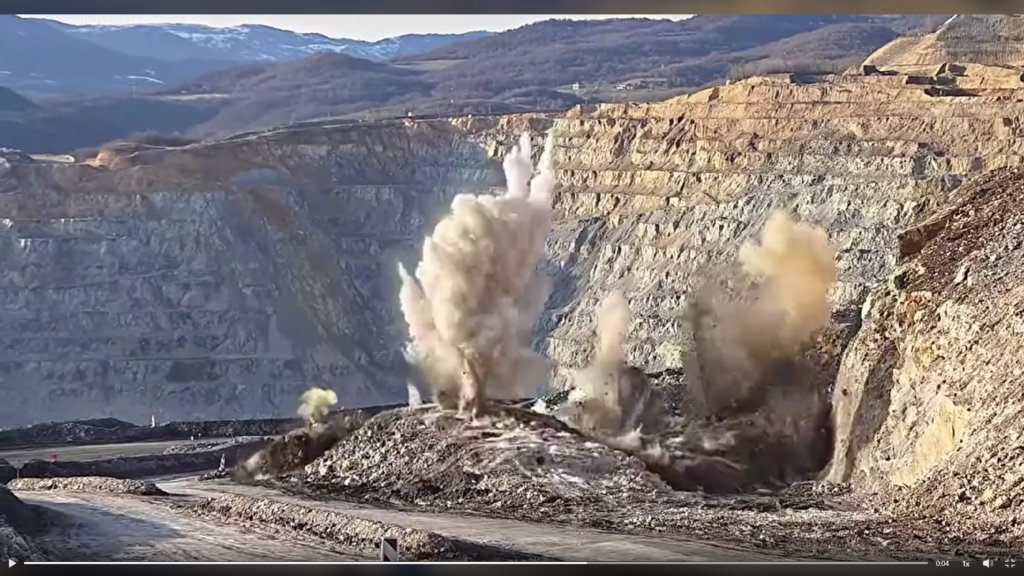
WipFrag enables accurate fragmentation analysis from blast images, providing essential data for evaluating blasting effectiveness. It supports continuous improvement by identifying oversize issues, optimizing blast designs, and ensuring crusher compatibility. With real-time feedback and specification envelopes, it enhances decision-making, and improves overall mine-to-mill performance efficiently. Read a case study paper HERE Video credits to Goran Petrovic
WipFrag
Understanding the Fundamentals of Blasting and Fragmentation Part 2
Blasting and fragmentation are critical operations in mining and quarrying, significantly influencing downstream processes such as loading, hauling, and crushing. At the core of successful blasting lies a precise understanding of how energy is distributed through the rock mass. Among the key factors that can drastically affect blast outcomes is drilling deviation, a common but often underestimated issue that alters the intended blast geometry.
The Impact of Drilling Deviation
In an ideal blast design, drill holes are positioned and angled according to a specific pattern to ensure optimal burden spacing, energy distribution, and shock wave interaction. However, drilling deviation, which refers to the unintentional displacement or misalignment of blast holes can disrupt this pattern (Adebayo & Mutandwa, 2015).
When holes deviate, the spacing and burden between them can become inconsistent. This misalignment affects shock wave propagation, leading to uneven energy transfer across the rock mass. In zones where spacing is too wide, the energy dissipates prematurely, resulting in poor rock breakage. Conversely, overly tight spacing can cause excessive energy concentration, increasing the risk of overbreak and flyrock.
These irregularities directly influence rock fracturing. A well-fractured rock mass ensures the production of uniformly sized fragments. But with drilling deviation, fragmentation becomes unpredictable. As a result, the blast may yield a mix of fines, oversize boulders, and inadequate intermediate sizes, which compromise both crusher compatibility and operational efficiency.
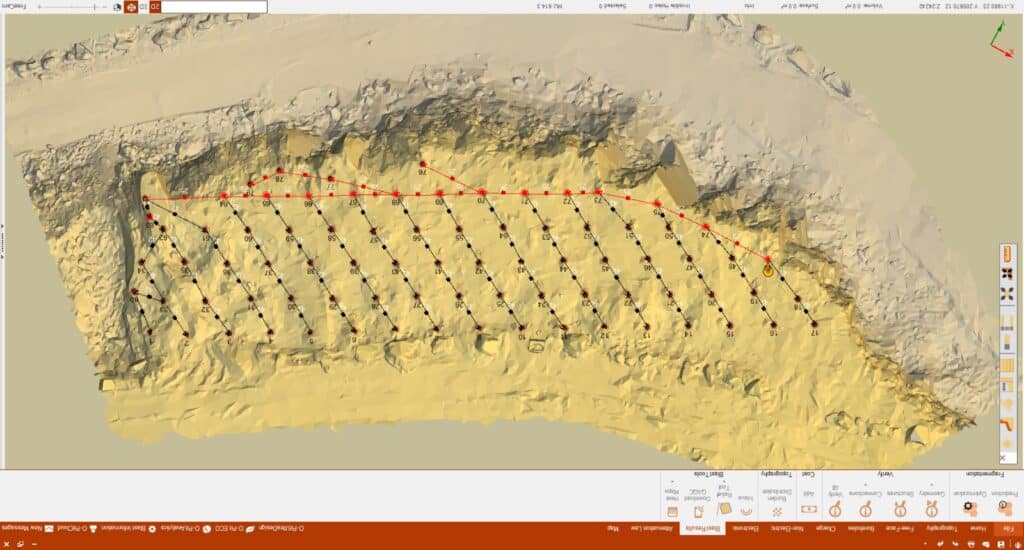
Approaches for Calculating Drill Hole Deviation (Manzoor et al., 2022)
Drill hole deviation refers to the departure of a drilled hole from its intended path in terms of length, direction, and angle. Accurate assessment of this deviation is essential in mining and civil engineering projects where the precision of hole placement affects fragmentation, blasting efficiency, and overall project outcomes. There are several practical approaches used to define and evaluate drill hole deviation, particularly focusing on hole length variation, toe deviation, and hole angle.
1. Hole Length Variation Approach
This approach compares the actual drilled hole length to the designed or planned length. In many cases, the planned length is measured from the collar (starting point) to the expected toe (bottom of the hole) along a straight path. Deviations in length often indicate that the drill has wandered off the intended path, especially in steeply inclined or deep holes.
Shorter holes than planned can suggest upward deviation or bending along the path.
Longer holes may indicate downward deviation or drilling past the toe due to misalignment or geological inconsistencies.
Monitoring length variation is particularly useful in controlled environments where design lengths are standardized. This method is a straightforward first check to determine if a hole might be deviating and to what extent.
2. Toe Deviation Approach
Toe deviation assesses the horizontal and vertical displacement of the actual hole end point (toe) from its intended or designed location. This is a direct measure of deviation and one of the most reliable indicators of drilling accuracy.
Toe deviation is typically evaluated using survey tools or borehole tracking systems that pinpoint the actual toe position.
Displacement in the horizontal plane indicates lateral drift.
Displacement in the vertical plane can suggest a variation in drilling dip or depth.
Understanding toe deviation is crucial in blast design and mineral exploration, where accurate positioning at the bottom of the hole influences rock breakage efficiency, ore recovery, and safety.
3. Hole Angle Deviation Approach
Angle deviation refers to the difference between the planned drill angle and the actual drilled angle. This can be assessed at various points along the hole but is especially important at the collar and near the toe.
Even small angle deviations can cause significant offset at the toe in long holes.
Deviations can occur in both the azimuth (horizontal angle) and the inclination (vertical angle), leading to spiraling or drifting holes.
Angle deviation is commonly tracked using a gyro or borehole camera, and its identification is vital in situations where hole alignment impacts the outcome, such as in perimeter control blasting or directional drilling.
Particle Size Distribution Consequences
Poor fragmentation due to drilling deviation leads to:
Increased presence of boulders that require secondary breaking.
Excessive fines that may cause dust problems and reduce haulage efficiency.
A wider particle size distribution (PSD) curve, indicating inefficient energy usage and poor blast performance.
Recommendation: Using WipFrag for Improvement
To mitigate the effects of drilling deviation and ensure consistent fragmentation, incorporating WipFrag image analysis software into the blast assessment process is highly recommended. WipFrag enables:
Real-time fragmentation analysis, helping to evaluate PSD curves right after the blast.
Identification of zones with excessive boulders or fines, linking these to potential drilling inaccuracies.
Comparison of multiple blast results to detect patterns in performance deviations caused by hole misalignment.
Using WipFrag’s specification envelope tool, engineers can assess if the fragmentation meets crusher compatibility standards and adjust their drilling and blasting parameters accordingly. Furthermore, integrating WipFrag into a continuous improvement cycle ensures better control over drilling precision, energy distribution, and overall blast performance.
Conclusion
Understanding the fundamentals of blasting goes beyond explosive placement, it demands accurate drilling. Drilling deviation disrupts the propagation of shock waves and leads to poor fragmentation, affecting both safety and productivity. Leveraging tools like WipFrag empowers mining professionals to monitor, analyze, and improve blast results, ensuring a more efficient and cost-effective operation.
References
Adebayo, B., & Mutandwa, B. (2015). Correlation of blast-hole deviation and area of block with fragment size and fragmentation cost. International Research Journal of Engineering and Technology (IRJET), 2(7), 402-406.
Manzoor, S., Danielsson, M., Söderström, E., Schunnesson, H., Gustafson, A., Fredriksson, H., & Johansson, D. (2022). Predicting rock fragmentation based on drill monitoring: A case study from Malmberget mine, Sweden. Journal of the Southern African Institute of Mining and Metallurgy, 122(3), 155-165.
Riflesso
Understanding the Fundamentals of Blasting and Fragmentation – Part 1
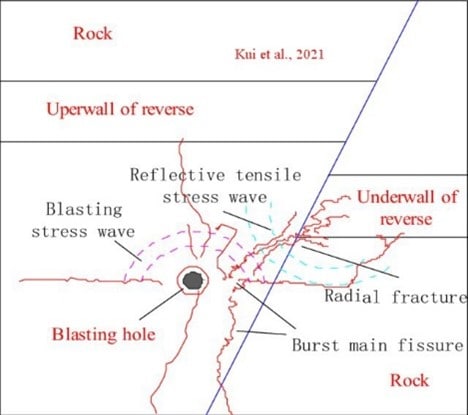
Blasting is a critical operation in mining, quarrying, and construction that involves the controlled detonation of explosives to break rock into manageable fragments. The fundamental principle behind blasting lies in understanding the interaction between explosive energy and rock mechanics, particularly the propagation of shock waves and the subsequent formation of fractures.
The Shock-Wave Theory of Blasting
The shock-wave theory provides a framework for understanding how explosive energy transforms into mechanical work, breaking the rock. As mentioned by Hino, (1956), when an explosive charge detonates, it generates an intense shock wave accompanied by a rapid release of gas and energy.
This energy produces two primary effects:
1. Crushed Zone Formation:
Near the explosive charge, the rock undergoes intense compressive stress, exceeding its compressive strength. This creates a crushed zone, a region where the rock is pulverized into fine fragments. However, because rocks generally have a high compressive strength, this crushed zone is limited to the immediate vicinity of the charge.
Figure 1 )Shadab Far et al., 2019)
2. Shock Wave Propagation:
Beyond the crushed zone, a high-pressure shock wave propagates outward as a compressive wave. This wave does not immediately cause rock breakage but transfers energy through the rock mass.
At the first free face (a boundary with no external constraint, such as the surface of a bench or tunnel wall), the compressive wave reflects as a tensile wave. In rock mechanics, this transition is crucial because rocks are significantly weaker under tensile stress than under compressive stress. As the tensile wave interacts with the rock, fractures form when the effective tension the difference between the reflected tensile wave and any residual compression exceeds the rock’s tensile strength (Himanshu et al., 2024).
Thickness of the First Slab and Fragmentation
The initial fracture caused by the tensile wave occurs at a distance from the free face known as the thickness of the first slab (Hino, 1956). This distance is critical because:
It determines the size of the initial fragment.
Other fragment dimensions are generally proportional to this thickness.
If the remaining compressive wave retains sufficient energy after the detachment of the first slab, it continues propagating outward (See Figure 2). This process repeats at newly created free faces, producing successive layers of fractures and reducing the rock into smaller fragments. The cycle continues until the energy of the compressive wave diminishes below the tensile strength of the rock.
The interaction between these phenomena: shock wave propagation, energy dissipation, and rock strength, governs the fragmentation process. Understanding these principles allows blasting engineers to optimize blast designs to achieve desired fragment sizes, minimize blast induced issues like ground vibration, flyrock, overbreak, and ensure efficient downstream operations.
Factors Affecting Shock-Wave Propagation and Fragmentation
Several factors influence the effectiveness of a blast and the resulting fragmentation:
1. Explosive Properties
The energy content, detonation velocity, and confinement of explosives significantly affect the shock wave’s intensity and duration.
2. Rock Properties
Variations in rock strength, density, and structure (e.g., joints, fractures, and bedding planes) influence the propagation of shock and tensile waves.
3. Blast Design Parameters:
Hole diameter, spacing, burden, and the placement of charges determine the distribution of energy and the resulting fragmentation.
4. Free Face Orientation:
The presence and orientation of free faces play a pivotal role in enabling tensile wave reflection and fracture initiation.
5. Energy Distribution:
Proper distribution of explosive energy ensures uniform fragmentation and minimizes the generation of oversize boulders or fines.
Importance of Fragmentation in Mining Operations
Effective fragmentation is essential for the efficiency and cost-effectiveness of mining operations. Well-fragmented rock facilitates:
Reduced loading and hauling costs.
Improved crusher throughput and efficiency.
Lower energy consumption in downstream processing.
Enhanced safety by minimizing the occurrence of hazardous oversize boulders.
Importance of Assessing Blast Performance and Output
WipFrag, a state-of-the-art image analysis software, revolutionizes the assessment of blast performance and fragmentation. By analyzing images of fragmented rock, WipFrag provides precise and actionable insights into the quality of a blast. Here’s how WipFrag enhances blasting operations:
1. Particle Size distribution (PSD) Analysis:
WipFrag generates PSD curves that quantify the size range of rock fragments, enabling operators to evaluate whether the fragmentation meets specifications.
2. Specification Envelope Assessment
The software allows users to define specification envelopes for crusher-compatible fragmentation. Deviations from these envelopes highlight areas for improvement in blast design.
3. Boulder Identification and Counting:
WipFrag’s advanced algorithms detect and count oversize boulders, providing critical data for optimizing explosive placement and burden.
4. Image Merging and Orthomosaic Integration:
The capability to merge multiple images ensures comprehensive analysis of large muck piles. Integration with drone orthomosaics enables wide-area assessment of blast results.
5. Continuous Improvement:
By comparing fragmentation results across blasts, WipFrag supports continuous improvement in blasting practices, reducing costs and improving efficiency.
6. Real-Time Analysis:
Integration with systems like Solo 6 and Reflex 6 facilitates real-time monitoring and analysis, ensuring immediate feedback for decision-making.
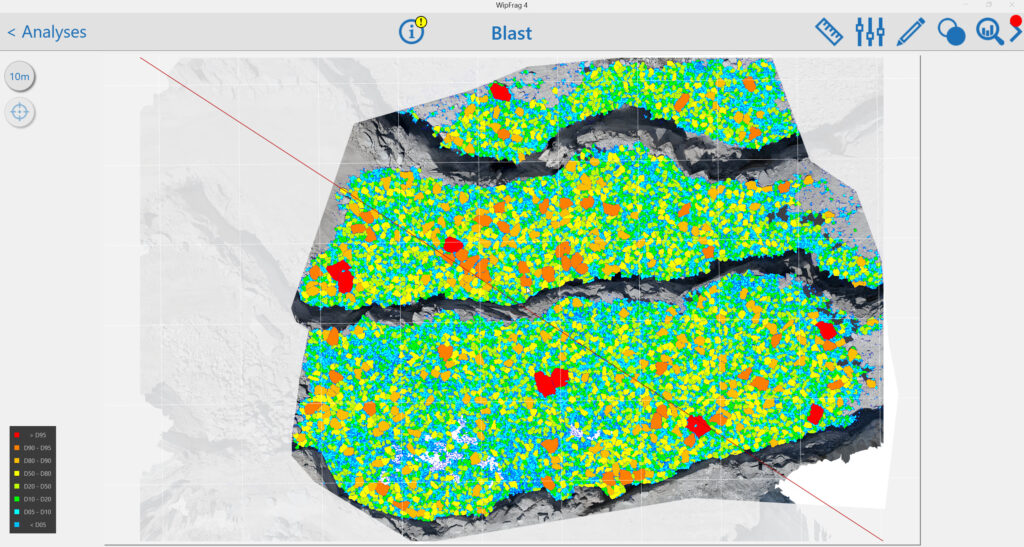
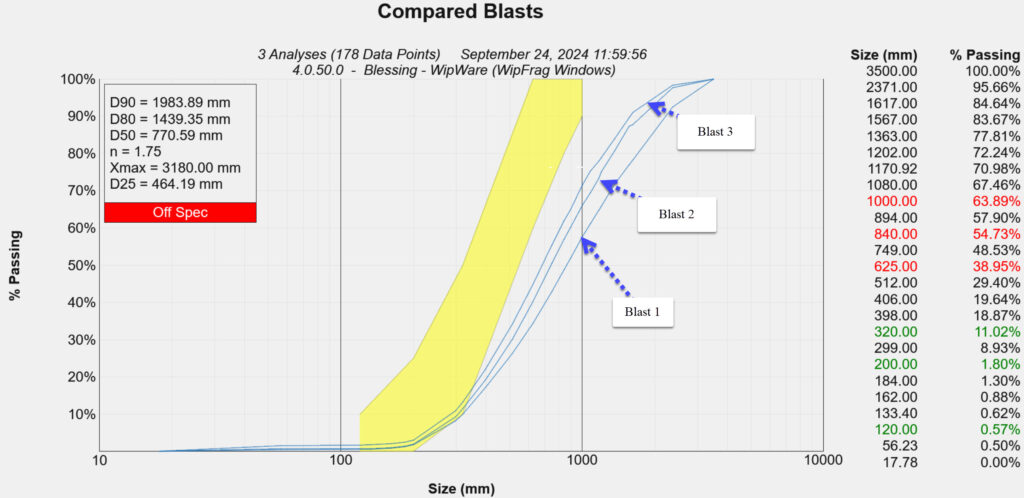
Figure 3
Figure 3 showcases results obtained from the WipFrag software, illustrating its capabilities in fragmentation analysis.
Figure 3a presents the GIS-integrated on-site fragmentation assessment. This feature, embedded within WipFrag, allows users to visualize blast results spatially. The red sections of the GIS map highlight areas with poor blast outcomes, whereas lighter colors like blue and green represent zones with favorable fragmentation.
Figure 3c displays the Particle Size Distribution (PSD) curves comparing three different blasts. The yellow envelope outlines the production specification of the case study mine, serving as a benchmark. WipFrag enables each mine to define their Key Performance Indicator (KPI) sizes and utilize them for ongoing assessments. This facilitates the evaluation of blast improvements over successive rounds.
Additionally, the PSD curves feature size classifications and flag specific sizes that deviate from mine production requirements, ensuring precise monitoring and alignment with operational goals.
This comprehensive analysis provided by WipFrag aids in identifying areas of improvement, optimizing blasting strategies, and enhancing overall mining efficiency.
Conclusion
Blasting and fragmentation are complex processes driven by the interaction of explosive energy, rock mechanics, and blast design parameters. Understanding these fundamentals is essential for optimizing operations and achieving desired outcomes. WipFrag software plays a pivotal role in this optimization by providing detailed and accurate fragmentation analysis, enabling operators to assess performance, identify areas for improvement, and implement data-driven strategies for continuous enhancement. With tools like WipFrag, the mining industry can achieve safer, more efficient, and cost-effective blasting operations (download software here https://wipware.com/get-wipfrag/).
References
Hino, K. (1956). Fragmentation of rock through blasting and shock wave theory of blasting. In ARMA US Rock Mechanics/Geomechanics Symposium (pp. ARMA-56). ARMA.
Himanshu, V. K., Bhagat, N. K., Vishwakarma, A. K., & Mishra, A. K. (2024). Principles and Practices of Rock Blasting. CRC Press.
Shadab Far, M., Wang, Y., & Dallo, Y. A. (2019). Reliability analysis of the induced damage for single-hole rock blasting. Georisk: Assessment and Management of Risk for Engineered Systems and Geohazards, 13(1), 82-98.
Utilizziamo i cookie sul nostro sito Web per offrirti l'esperienza più pertinente ricordando le tue preferenze e ripetendo le visite. Cliccando su "Accetta", acconsenti all'uso di TUTTI i cookie.
Questo sito Web utilizza i cookie per migliorare la tua esperienza durante la navigazione nel sito Web. Di questi, i cookie classificati come necessari vengono memorizzati nel browser in quanto sono essenziali per il funzionamento delle funzionalità di base del sito Web. Utilizziamo anche cookie di terze parti che ci aiutano ad analizzare e capire come utilizzi questo sito web. Questi cookie verranno memorizzati nel tuo browser solo con il tuo consenso. Hai anche la possibilità di disattivare questi cookie. Ma la disattivazione di alcuni di questi cookie potrebbe influire sulla tua esperienza di navigazione.
I cookie necessari sono assolutamente essenziali per il corretto funzionamento del sito web. Questi cookie garantiscono funzionalità di base e caratteristiche di sicurezza del sito web, in modo anonimo.
Cookie
Durata
Descrizione
cookielawinfo-checbox-analytics
11 mesi
Questo cookie è impostato dal plug-in di consenso sui cookie GDPR. Il cookie viene utilizzato per memorizzare il consenso dell'utente per i cookie nella categoria "Analytics".
cookielawinfo-checbox-funzionale
11 mesi
Il cookie è impostato dal consenso cookie GDPR per registrare il consenso dell'utente per i cookie nella categoria "Funzionali".
cookielawinfo-checbox-others
11 mesi
Questo cookie è impostato dal plug-in di consenso sui cookie GDPR. Il cookie viene utilizzato per memorizzare il consenso dell'utente per i cookie nella categoria "Altro.
cookielawinfo-checkbox-required
11 mesi
Questo cookie è impostato dal plug-in di consenso sui cookie GDPR. Il cookie viene utilizzato per memorizzare il consenso dell'utente per i cookie nella categoria "Necessario".
cookielawinfo-checkbox-performance
11 mesi
Questo cookie è impostato dal plug-in di consenso sui cookie GDPR. Il cookie viene utilizzato per memorizzare il consenso dell'utente per i cookie nella categoria "Prestazioni".
viewed_cookie_policy
11 mesi
Il cookie è impostato dal plug-in GDPR Cookie Consent e viene utilizzato per memorizzare se l'utente ha acconsentito o meno all'uso dei cookie. Non memorizza alcun dato personale.
I cookie funzionali aiutano a eseguire determinate funzionalità come la condivisione del contenuto del sito Web su piattaforme di social media, la raccolta di feedback e altre funzionalità di terze parti.
I cookie sulle prestazioni vengono utilizzati per comprendere e analizzare gli indici di prestazioni chiave del sito Web che aiutano a fornire una migliore esperienza utente per i visitatori.
I cookie analitici vengono utilizzati per capire come i visitatori interagiscono con il sito web. Questi cookie aiutano a fornire informazioni sulle metriche del numero di visitatori, frequenza di rimbalzo, sorgente di traffico, ecc.
I cookie pubblicitari vengono utilizzati per fornire ai visitatori annunci e campagne di marketing pertinenti. Questi cookie tracciano i visitatori sui siti Web e raccolgono informazioni per fornire annunci personalizzati.