Blasting and fragmentation are critical operations in mining and quarrying, significantly influencing downstream processes such as loading, hauling, and crushing. At the core of successful blasting lies a precise understanding of how energy is distributed through the rock mass. Among the key factors that can drastically affect blast outcomes is drilling deviation, a common but often underestimated issue that alters the intended blast geometry.
The Impact of Drilling Deviation
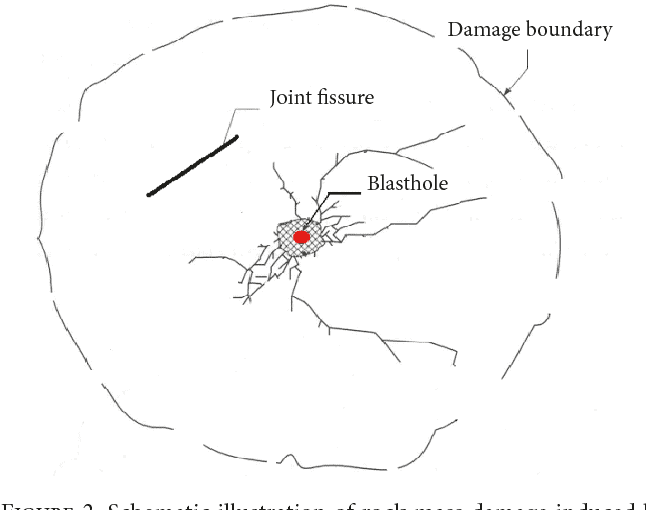
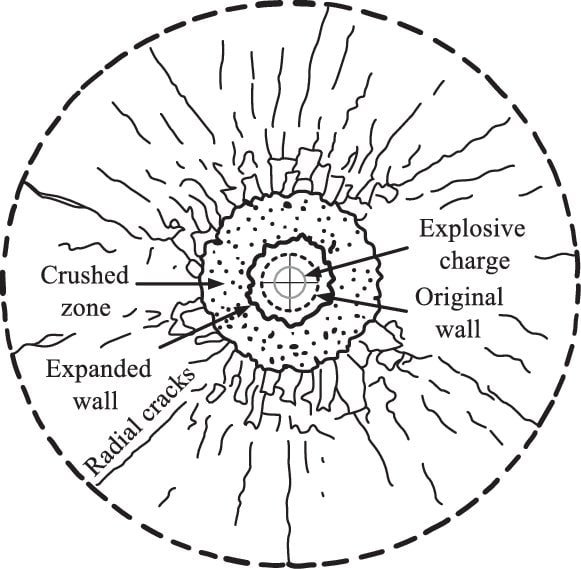
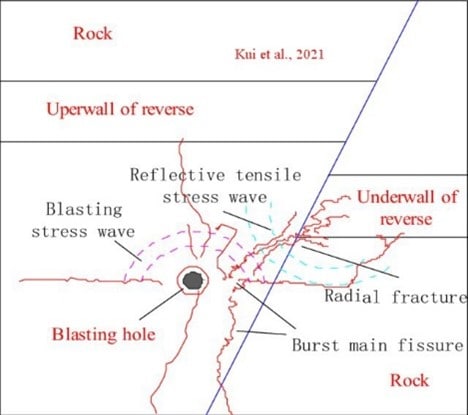
In an ideal blast design, drill holes are positioned and angled according to a specific pattern to ensure optimal burden spacing, energy distribution, and shock wave interaction. However, drilling deviation, which refers to the unintentional displacement or misalignment of blast holes can disrupt this pattern (Adebayo & Mutandwa, 2015).
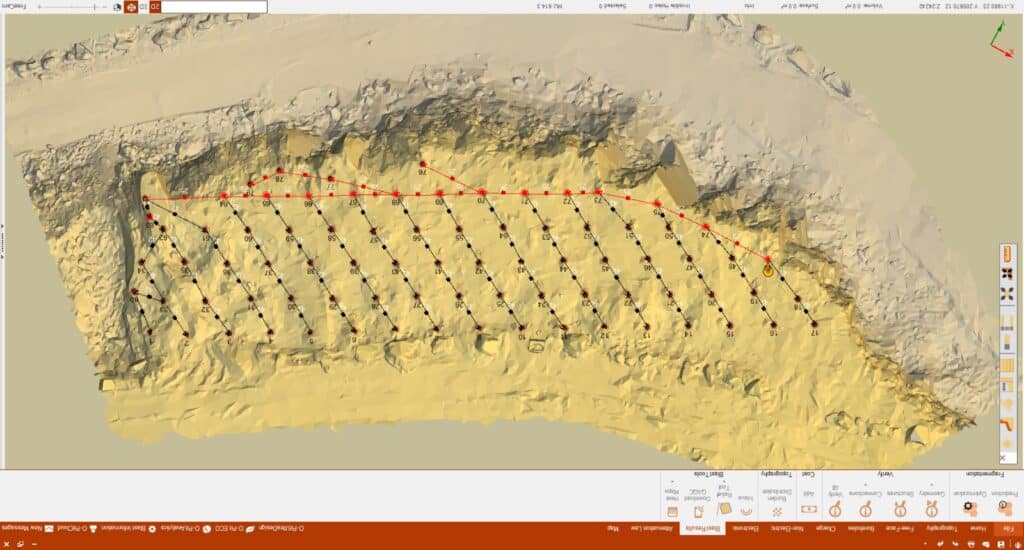
When holes deviate, the spacing and burden between them can become inconsistent. This misalignment affects shock wave propagation, leading to uneven energy transfer across the rock mass. In zones where spacing is too wide, the energy dissipates prematurely, resulting in poor rock breakage. Conversely, overly tight spacing can cause excessive energy concentration, increasing the risk of overbreak and flyrock.
These irregularities directly influence rock fracturing. A well-fractured rock mass ensures the production of uniformly sized fragments. But with drilling deviation, fragmentation becomes unpredictable. As a result, the blast may yield a mix of fines, oversize boulders, and inadequate intermediate sizes, which compromise both crusher compatibility and operational efficiency.
Approaches for Calculating Drill Hole Deviation (Manzoor et al., 2022)
Drill hole deviation refers to the departure of a drilled hole from its intended path in terms of length, direction, and angle. Accurate assessment of this deviation is essential in mining and civil engineering projects where the precision of hole placement affects fragmentation, blasting efficiency, and overall project outcomes. There are several practical approaches used to define and evaluate drill hole deviation, particularly focusing on hole length variation, toe deviation, and hole angle.
1. Hole Length Variation Approach
This approach compares the actual drilled hole length to the designed or planned length. In many cases, the planned length is measured from the collar (starting point) to the expected toe (bottom of the hole) along a straight path. Deviations in length often indicate that the drill has wandered off the intended path, especially in steeply inclined or deep holes.
- Shorter holes than planned can suggest upward deviation or bending along the path.
- Longer holes may indicate downward deviation or drilling past the toe due to misalignment or geological inconsistencies.
Monitoring length variation is particularly useful in controlled environments where design lengths are standardized. This method is a straightforward first check to determine if a hole might be deviating and to what extent.
2. Toe Deviation Approach
Toe deviation assesses the horizontal and vertical displacement of the actual hole end point (toe) from its intended or designed location. This is a direct measure of deviation and one of the most reliable indicators of drilling accuracy.
- Toe deviation is typically evaluated using survey tools or borehole tracking systems that pinpoint the actual toe position.
- Displacement in the horizontal plane indicates lateral drift.
- Displacement in the vertical plane can suggest a variation in drilling dip or depth.
Understanding toe deviation is crucial in blast design and mineral exploration, where accurate positioning at the bottom of the hole influences rock breakage efficiency, ore recovery, and safety.
3. Hole Angle Deviation Approach
Angle deviation refers to the difference between the planned drill angle and the actual drilled angle. This can be assessed at various points along the hole but is especially important at the collar and near the toe.
- Even small angle deviations can cause significant offset at the toe in long holes.
- Deviations can occur in both the azimuth (horizontal angle) and the inclination (vertical angle), leading to spiraling or drifting holes.
Angle deviation is commonly tracked using a gyro or borehole camera, and its identification is vital in situations where hole alignment impacts the outcome, such as in perimeter control blasting or directional drilling.
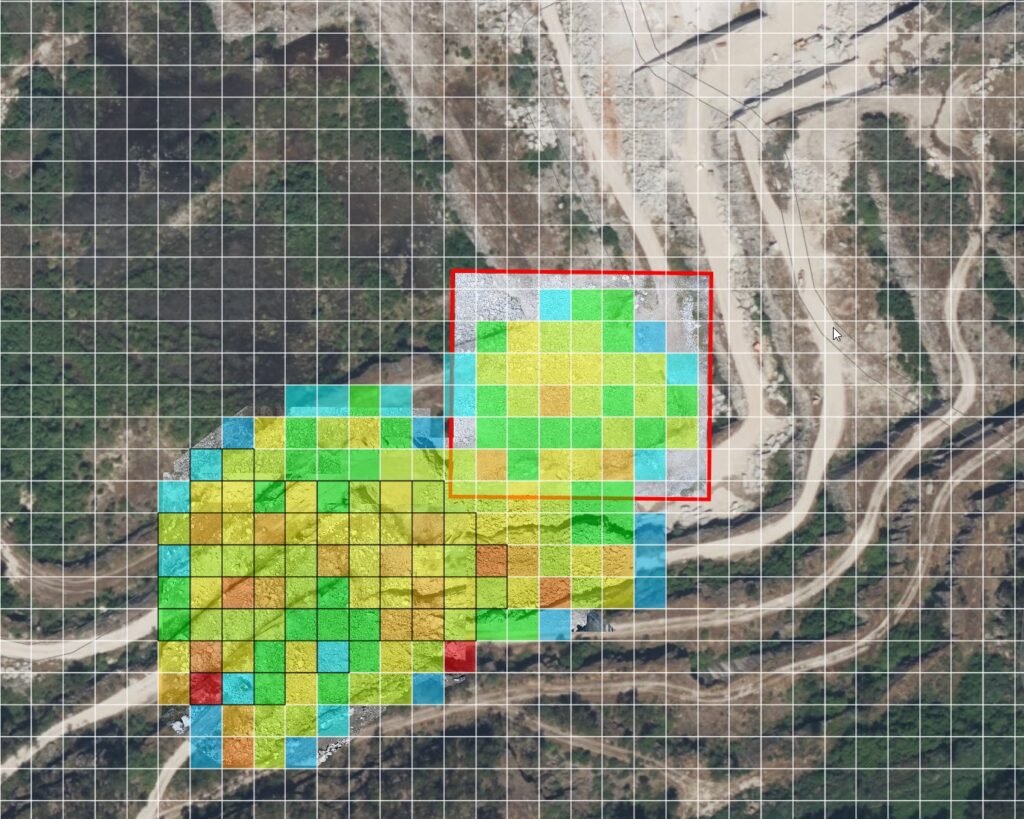
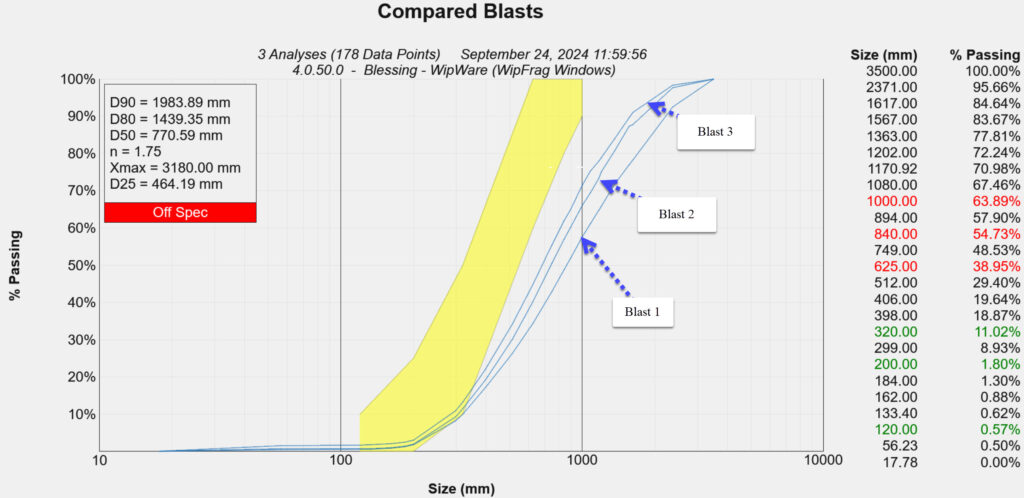
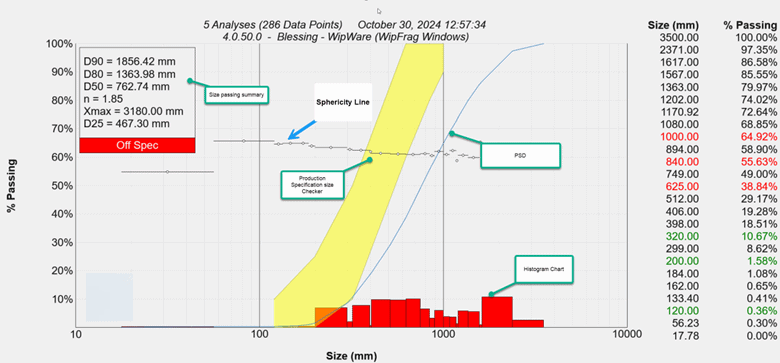
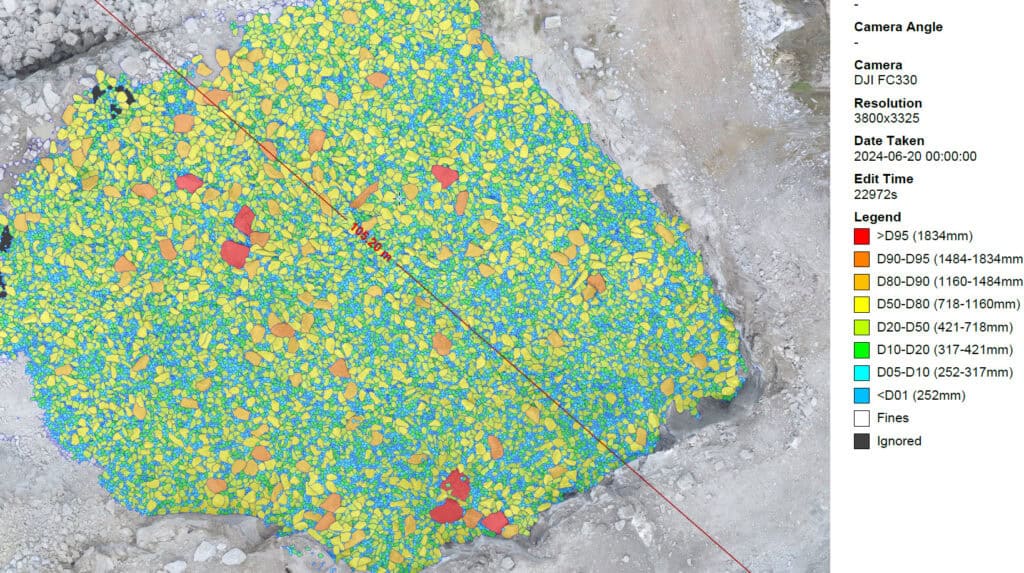
Particle Size Distribution Consequences
Poor fragmentation due to drilling deviation leads to:
- Increased presence of boulders that require secondary breaking.
- Excessive fines that may cause dust problems and reduce haulage efficiency.
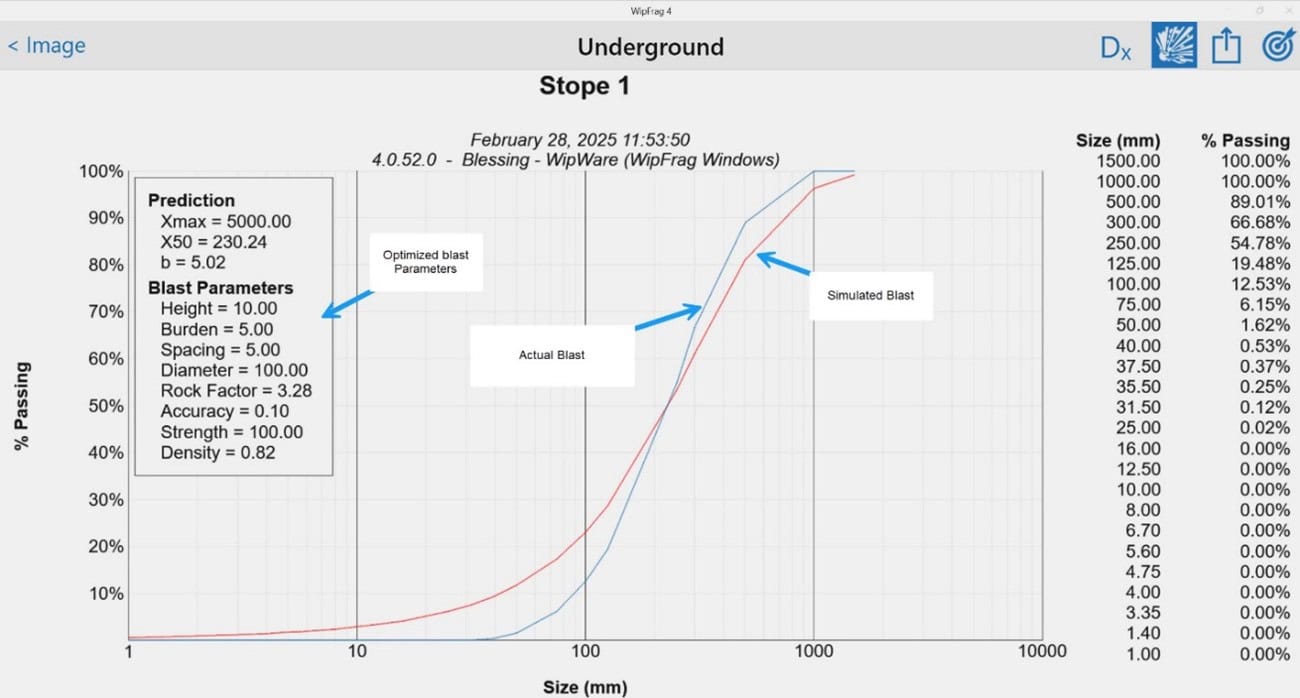
- A wider particle size distribution (PSD) curve, indicating inefficient energy usage and poor blast performance.
Recommendation: Using WipFrag for Improvement
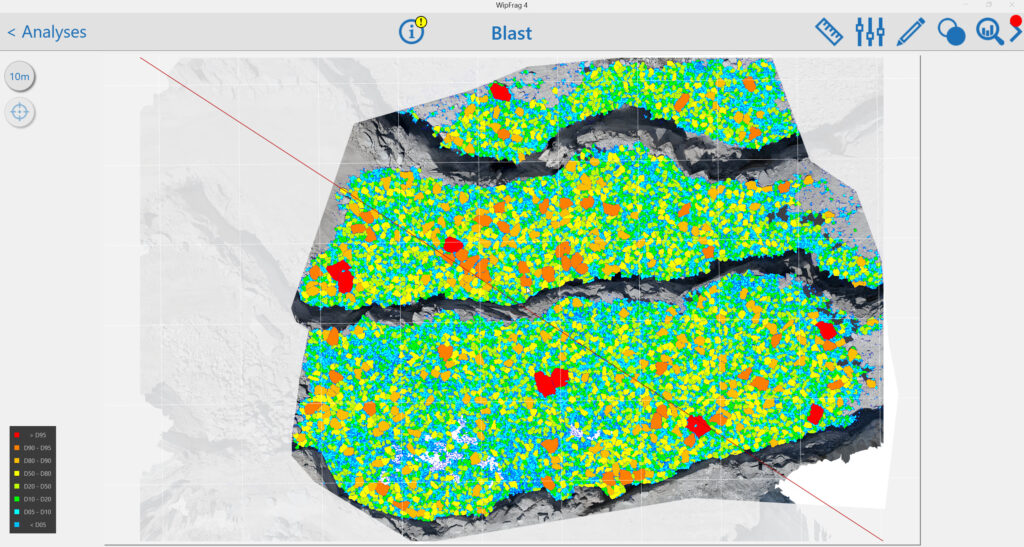
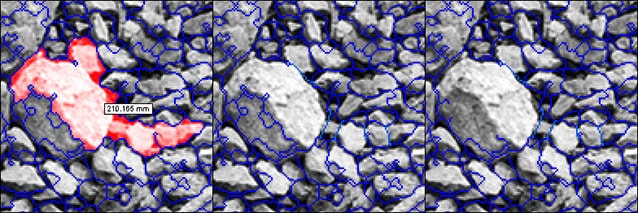
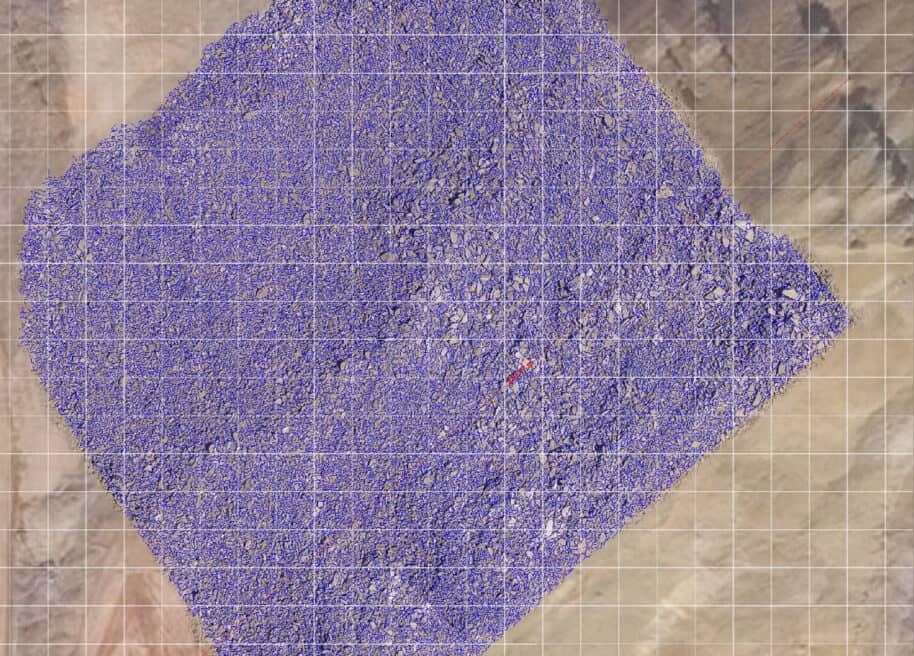
To mitigate the effects of drilling deviation and ensure consistent fragmentation, incorporating WipFrag image analysis software into the blast assessment process is highly recommended. WipFrag enables:
- Real-time fragmentation analysis, helping to evaluate PSD curves right after the blast.
- Identification of zones with excessive boulders or fines, linking these to potential drilling inaccuracies.
- Comparison of multiple blast results to detect patterns in performance deviations caused by hole misalignment.
Using WipFrag’s specification envelope tool, engineers can assess if the fragmentation meets crusher compatibility standards and adjust their drilling and blasting parameters accordingly. Furthermore, integrating WipFrag into a continuous improvement cycle ensures better control over drilling precision, energy distribution, and overall blast performance.
Conclusion
Understanding the fundamentals of blasting goes beyond explosive placement, it demands accurate drilling. Drilling deviation disrupts the propagation of shock waves and leads to poor fragmentation, affecting both safety and productivity. Leveraging tools like WipFrag empowers mining professionals to monitor, analyze, and improve blast results, ensuring a more efficient and cost-effective operation.
References
Adebayo, B., & Mutandwa, B. (2015). Correlation of blast-hole deviation and area of block with fragment size and fragmentation cost. International Research Journal of Engineering and Technology (IRJET), 2(7), 402-406.
Manzoor, S., Danielsson, M., Söderström, E., Schunnesson, H., Gustafson, A., Fredriksson, H., & Johansson, D. (2022). Predicting rock fragmentation based on drill monitoring: A case study from Malmberget mine, Sweden. Journal of the Southern African Institute of Mining and Metallurgy, 122(3), 155-165.