By: Kevin Rivard
Question: How can I see the data?
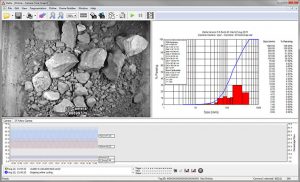
Answer: Both Delta and WipFrag produce a % passing or retained curve visible after each sieve. It also saves the data to a CSV (comma-separated values) file. Each sieve analysis produces a new line in the CSV file that represents the results from the sieve.
This CSV file contains:
– Timestamp (Year/Month/Day/Hour/Minute/Second)
– D-values (XX% passed the specified size – Ex. 90% of the material passes 13.87 inches[352.30mm])
– User specified size classes (% passing or retained at the specified size)
– Block (amount of particle detected)
– Min, Max, Mean, St. Dev, Mode
– Sphericity (The shape of the material – 0=Linear Objects 1=Perfectly Round)
– Coverage (How much of the image is used)
– Calibration Values (b, Xmax, X50, Xc and n)
– EDP values (Edge Detection Values)
– Calibration factors
– System info (CPU temp, Board temp, Voltage checks)
– System uptime
– Camera setting at the time of the image.
– Modbus and OPC poll rate
– Vehicle Identification Information (Reflex Only)
Delta can e-mail these CSV files automatically as well as an average of the entire day on one passing curve. It also has a trending graph in the lower section of the software interface which trends the data for the current day.
In addition, Delta has the ability to output the analysis information using a Modbus or OPC connection to pass information on to your historian, PLC or HMI.